


Technology
Power BI
Industry Life Science
Platform Web Dashboard
CapabilitiesData Storytelling Design Thinking
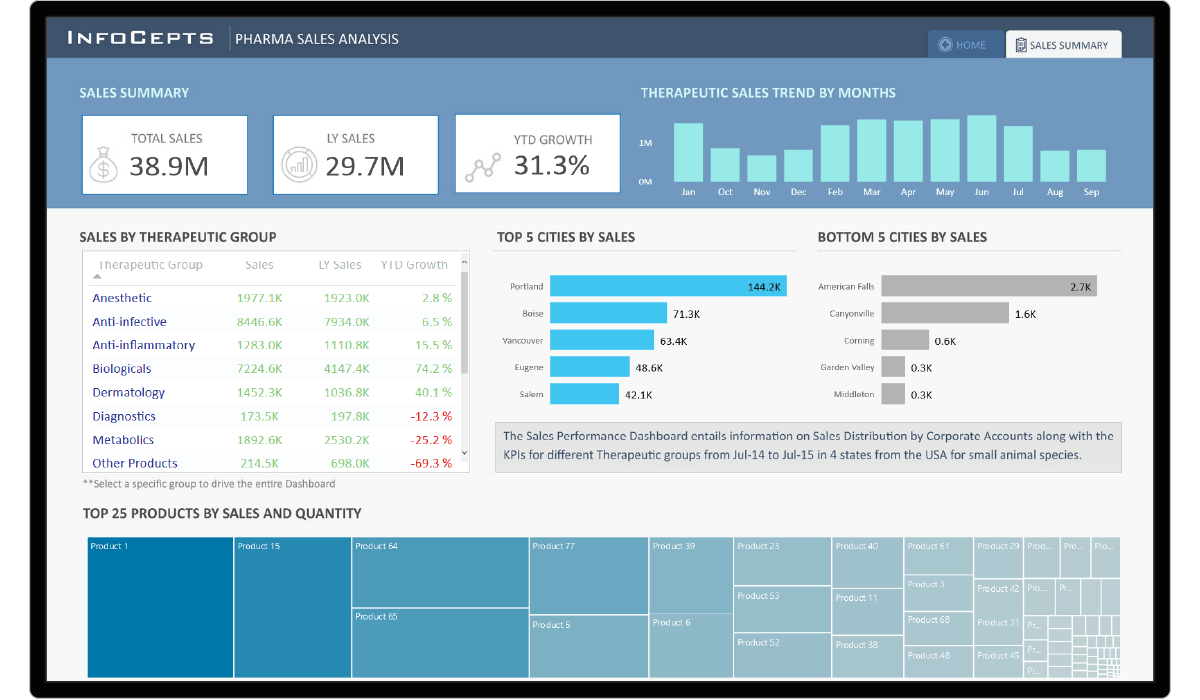
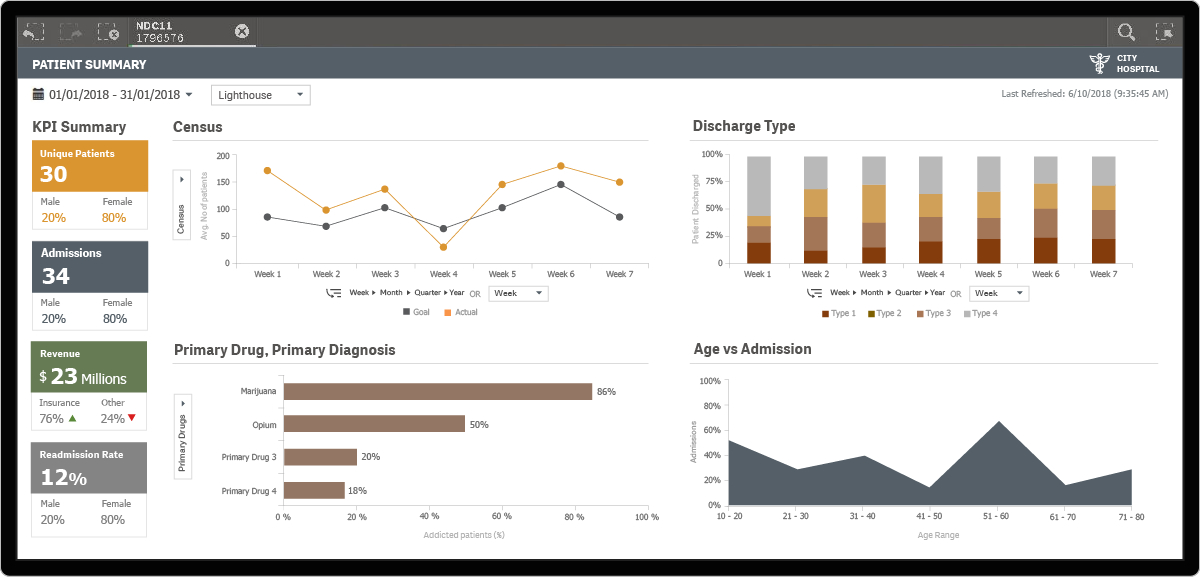
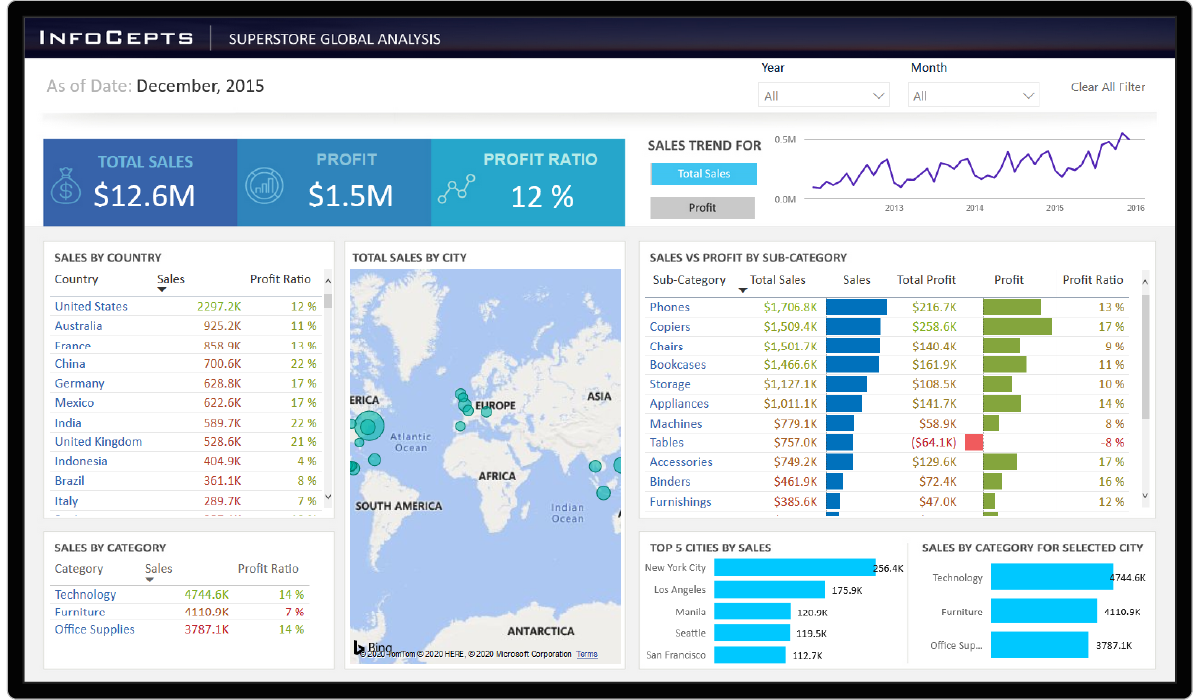
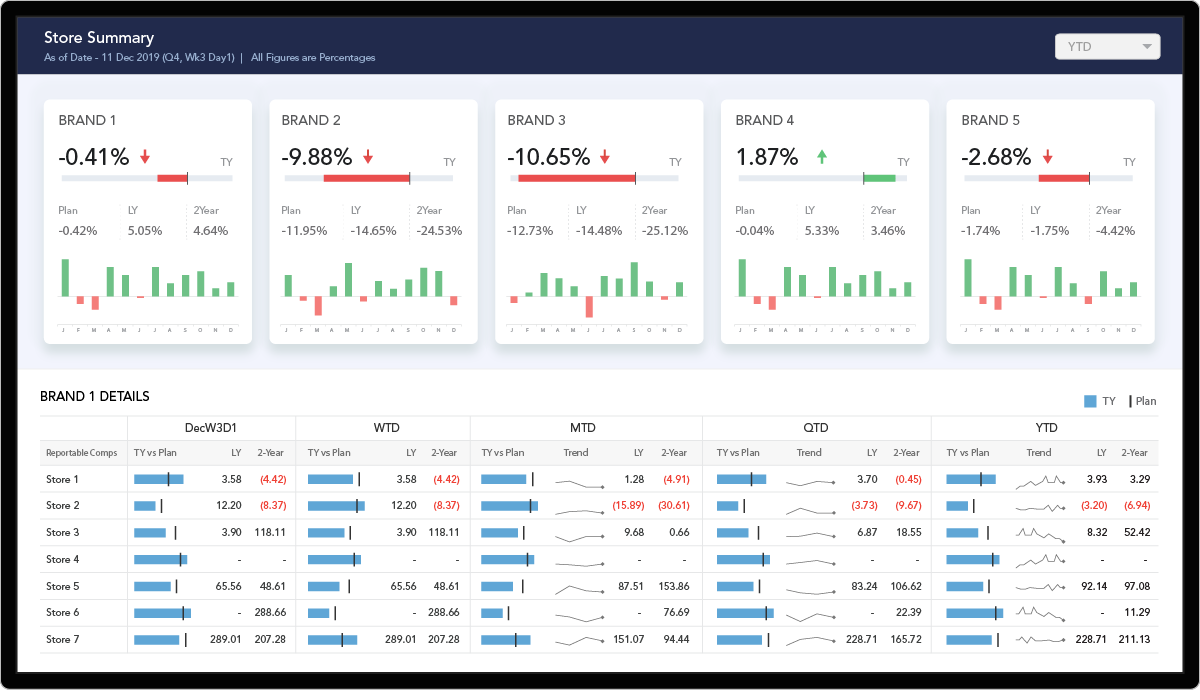
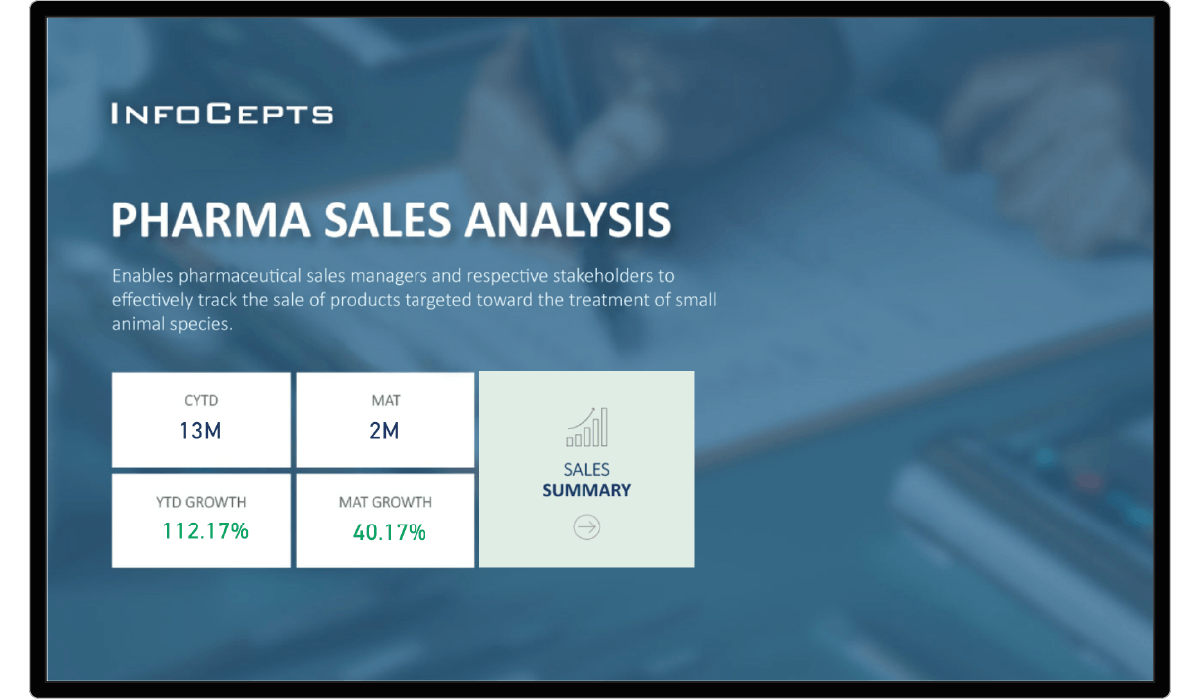
he Pharma Sales Analysis Dashboard can be leveraged by those in the Veterinary Pharmaceuticals domain to effectively track the Sale of Products targeted toward the treatment of small animal species. Users can quickly analyze the Top Five Cities and the Bottom Five Cities with respect to Product Sales. The dashboard provides a comprehensive report on Sales by Therapeutic Group. Additionally, it shows the therapeutic Sales Trends across any given period of time.
Challenges
Some of the major challenges faced by Pharmaceuticals Companies for Sales analysis are :
- No Centralised repository for storing data across geographies
- Extra time, efforts and poor analysis because of manual activities
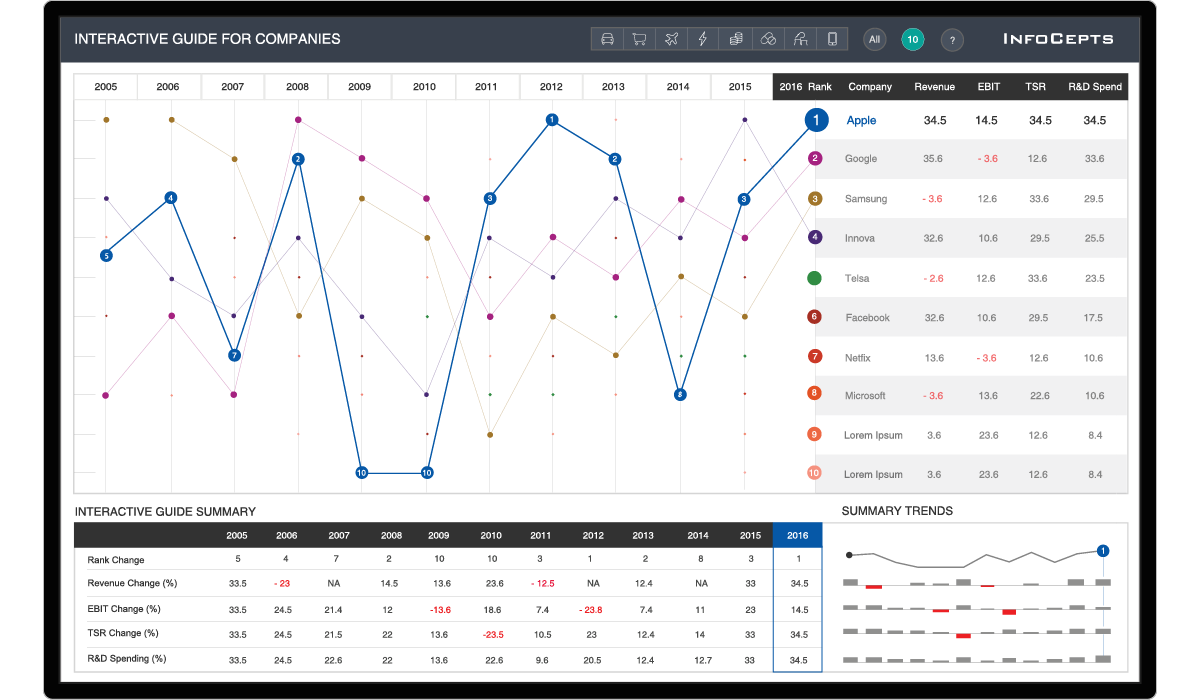
- No way to compare periodic sales (like YoY, Last year vs. this year, target vs. achieved etc.)
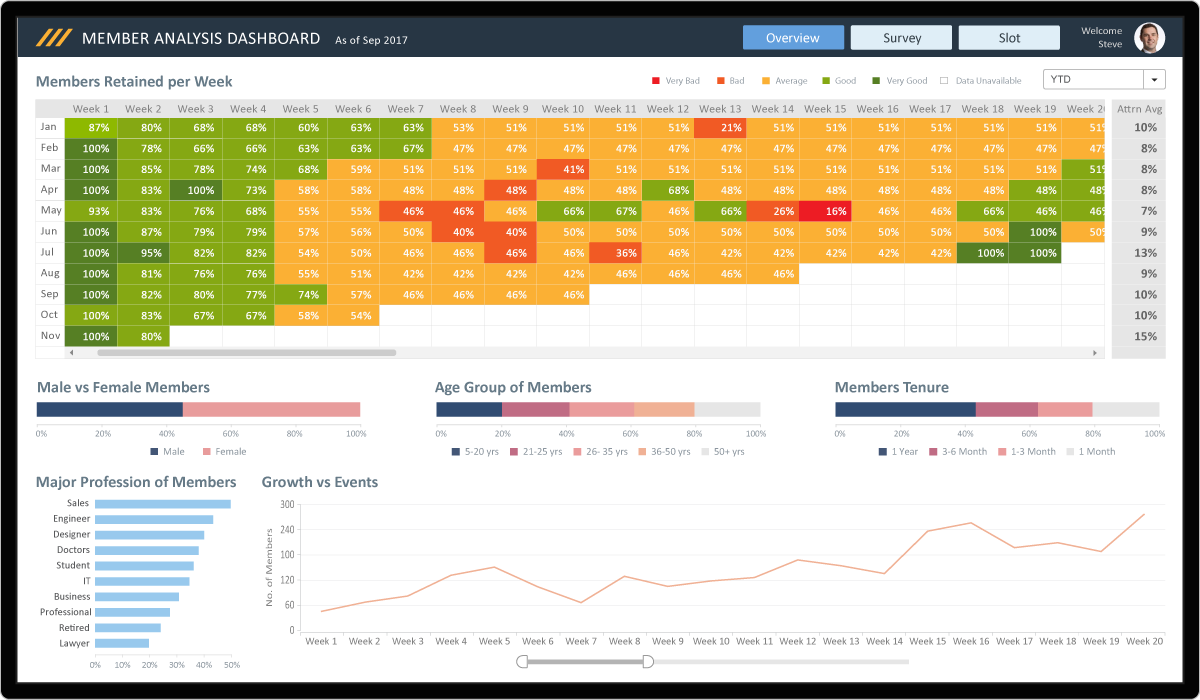
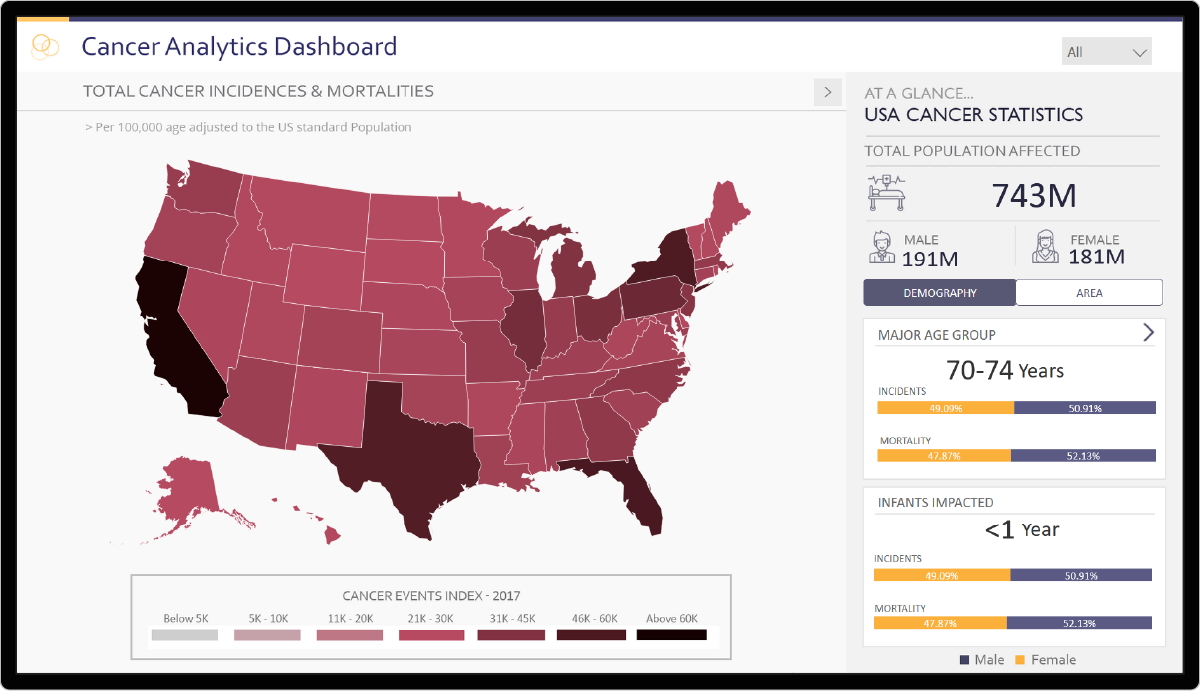
- No Insights on sales data across different categories
Solution
Our solution enabled the following capabilities to address customer challenges :
- Summarized data showing Total Sales, Last Year Sales, Growth, Month on month therapeutic sales trend
- Interactive dashboards providing capability to focus on a specific category
- Real time KPIs to track top 5 and Bottom 5 cities based on the Sales
- Capability to export and share the analysis and insights with higher management for better decision making
Reduced time to insight
Increased focus on non-performing categories
Precision in comparative analysis
Increase in informed decision making