


Technology
MicroStrategy
Industry Retail
Platform Web Dashboard
CapabilitiesData Storytelling Design Thinking
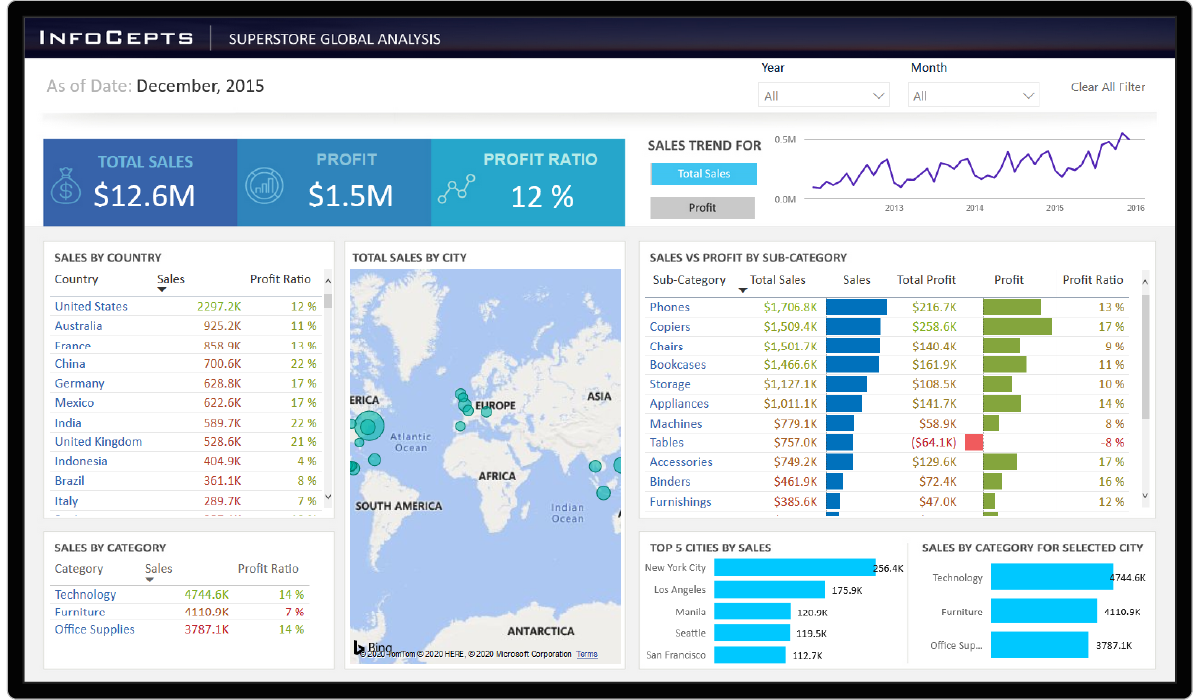
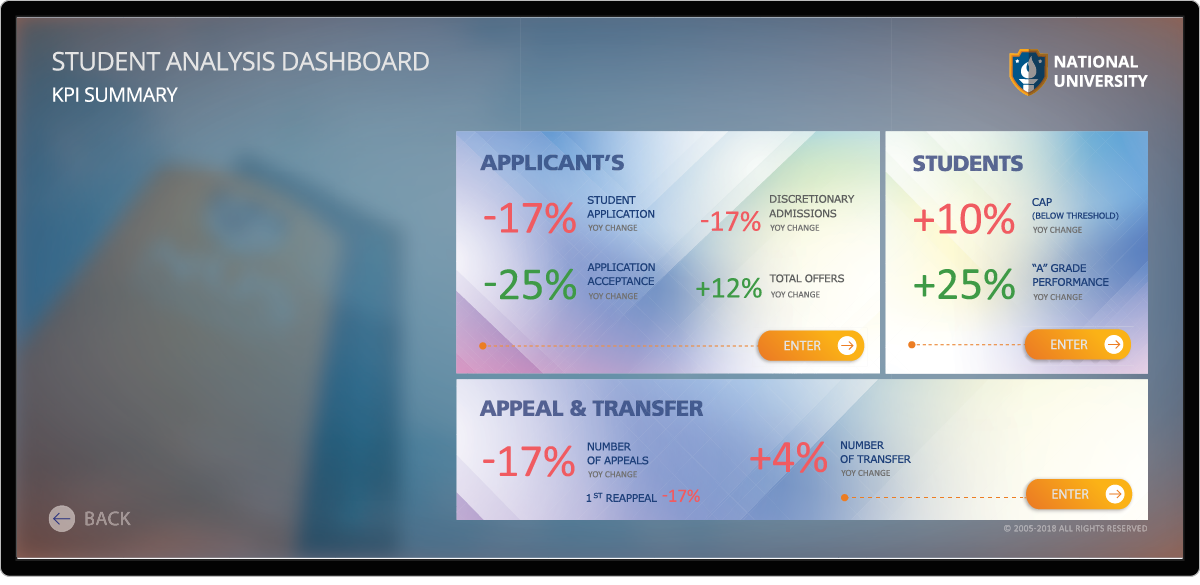
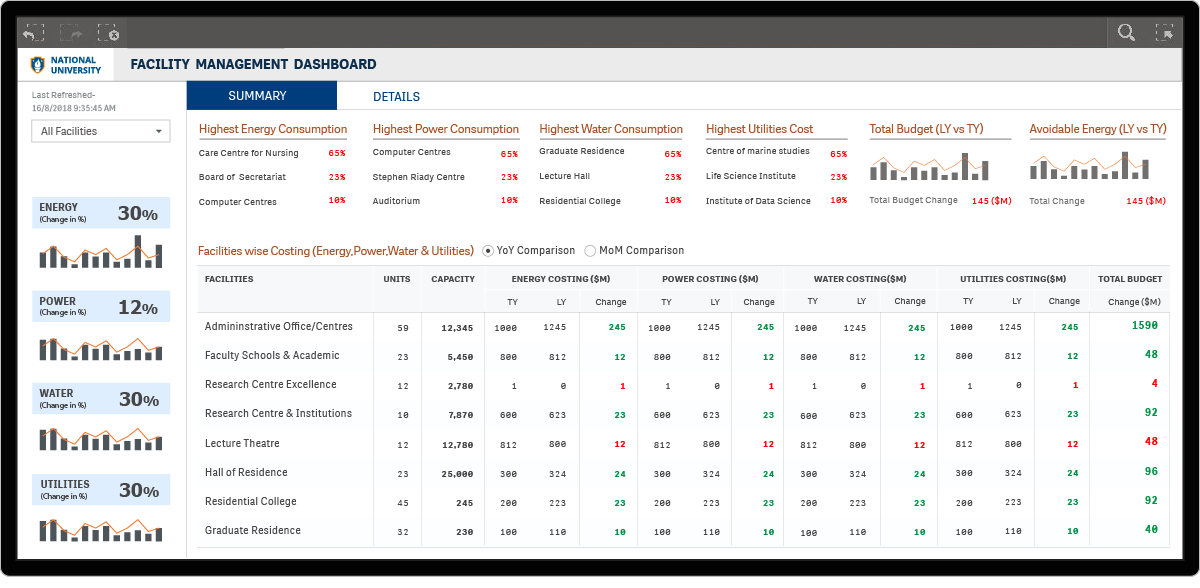
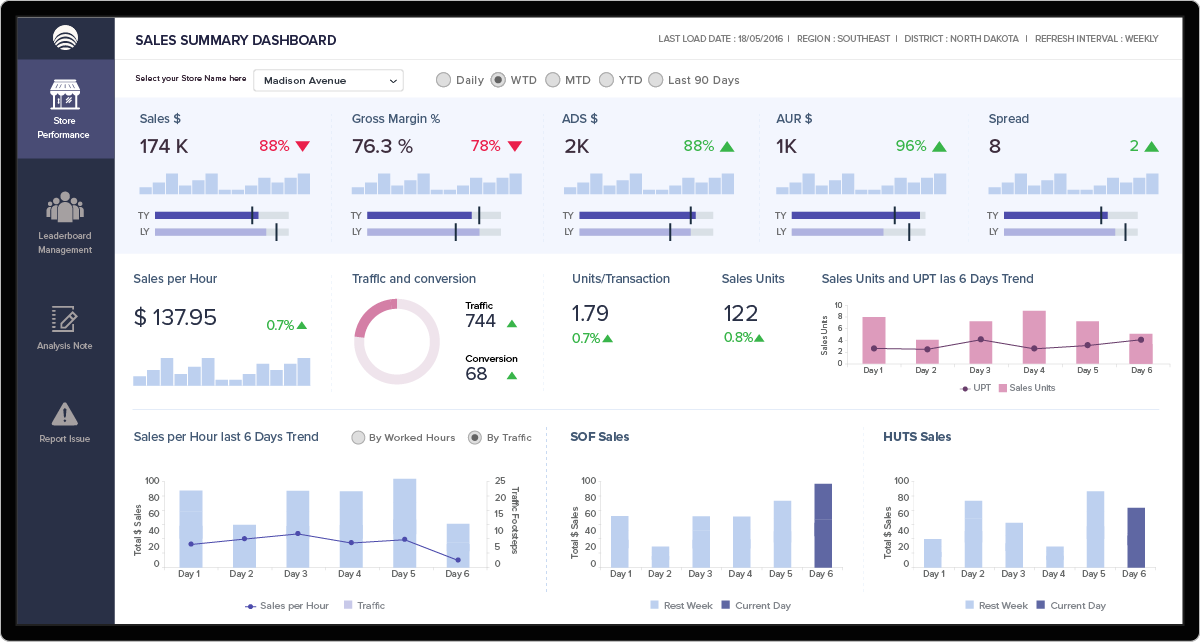
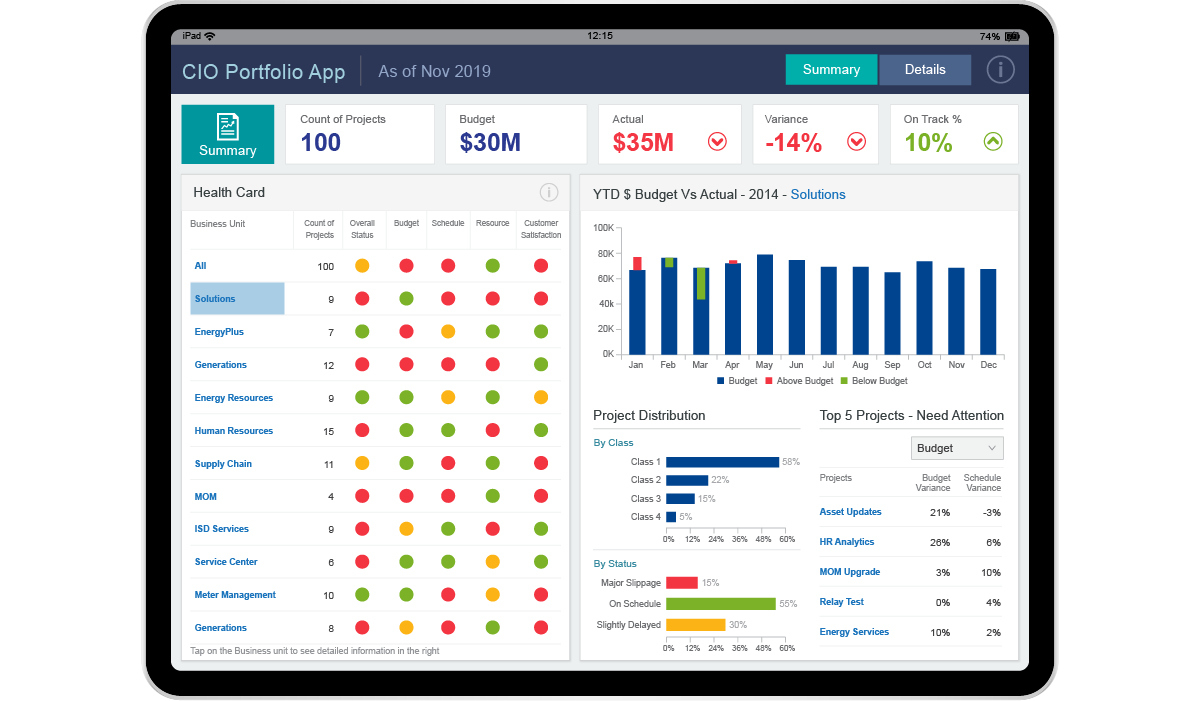
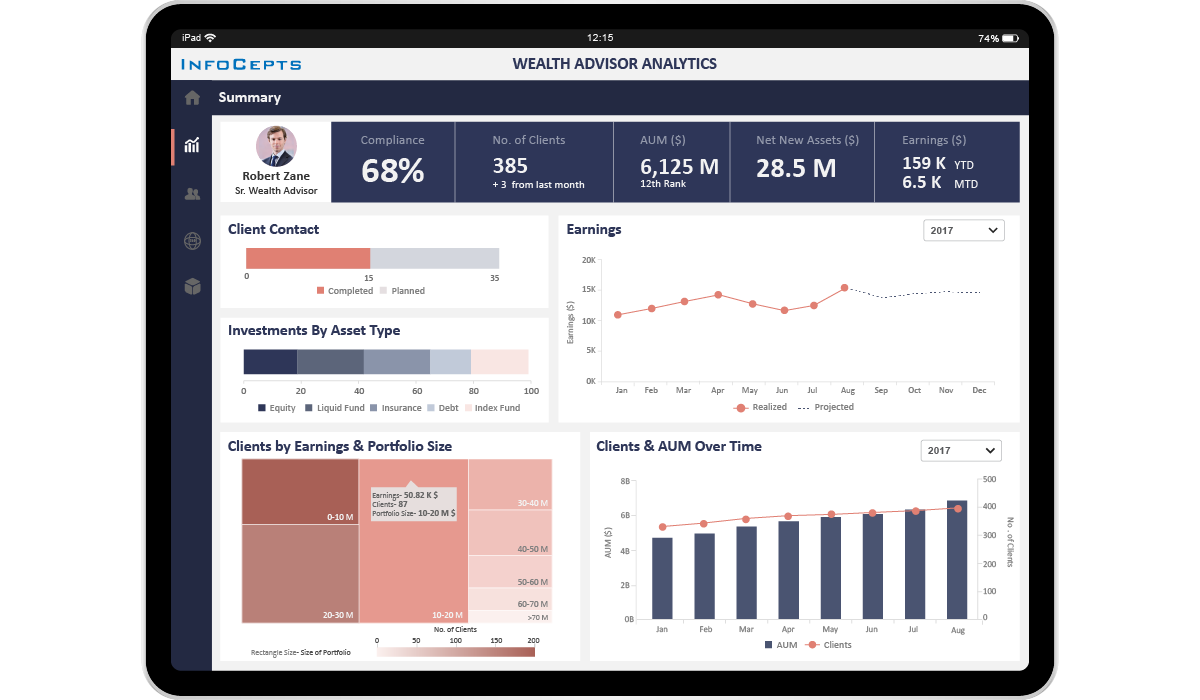
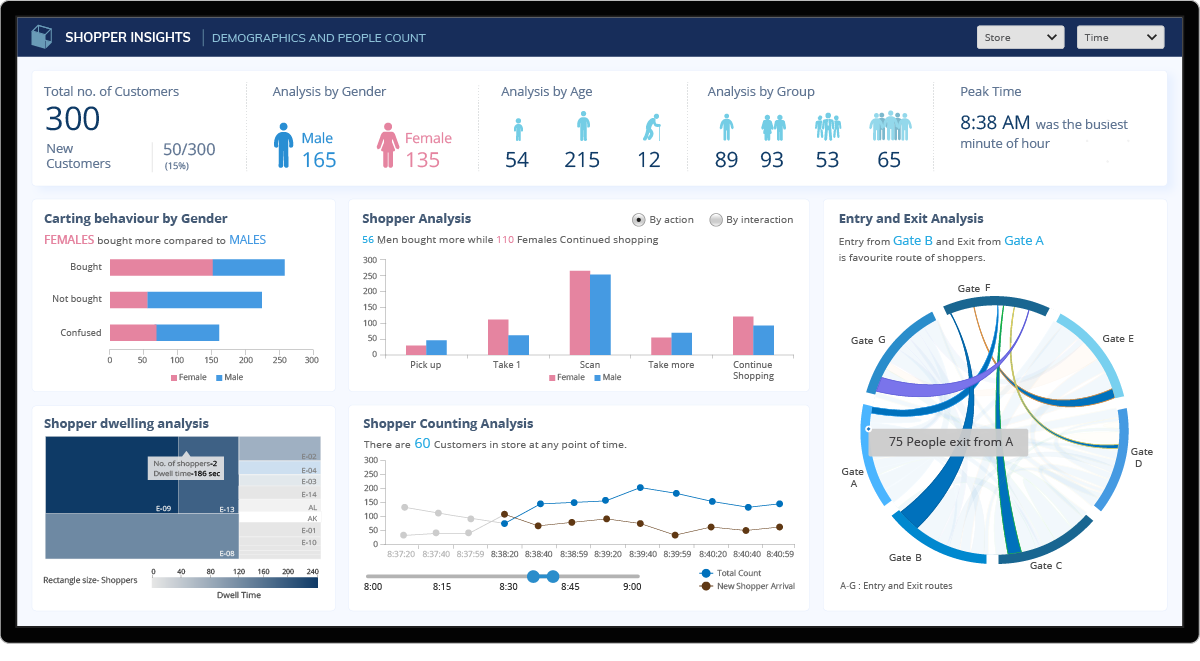
Our client, a prominent provider of Global Business Services has a proprietary one-stop retail operations solution. This platform analyzes the CCTV footage, converts videos to analyzable data and this data is extracted into multiple CSV files which form as a base to develop insights/ dashboards for its customers. We helped our client choose the right visualization platform and help develop intuitive, visually appealing, insightful dashboards on trends, correlations and outliers for its customers.
Challenges
Presentation of huge amount of data in graphical format was a huge challenge for the client which included :
- The data extraction had to be automated into 3-4 .csv files with a set of common data points
- Develop 1 or multiple dashboards from 3-4 .csv files with 5-6 visualizations graphs per page needed much design thinking and brainstorming
Solution
Our solution enabled the following capabilities to address customer challenges :
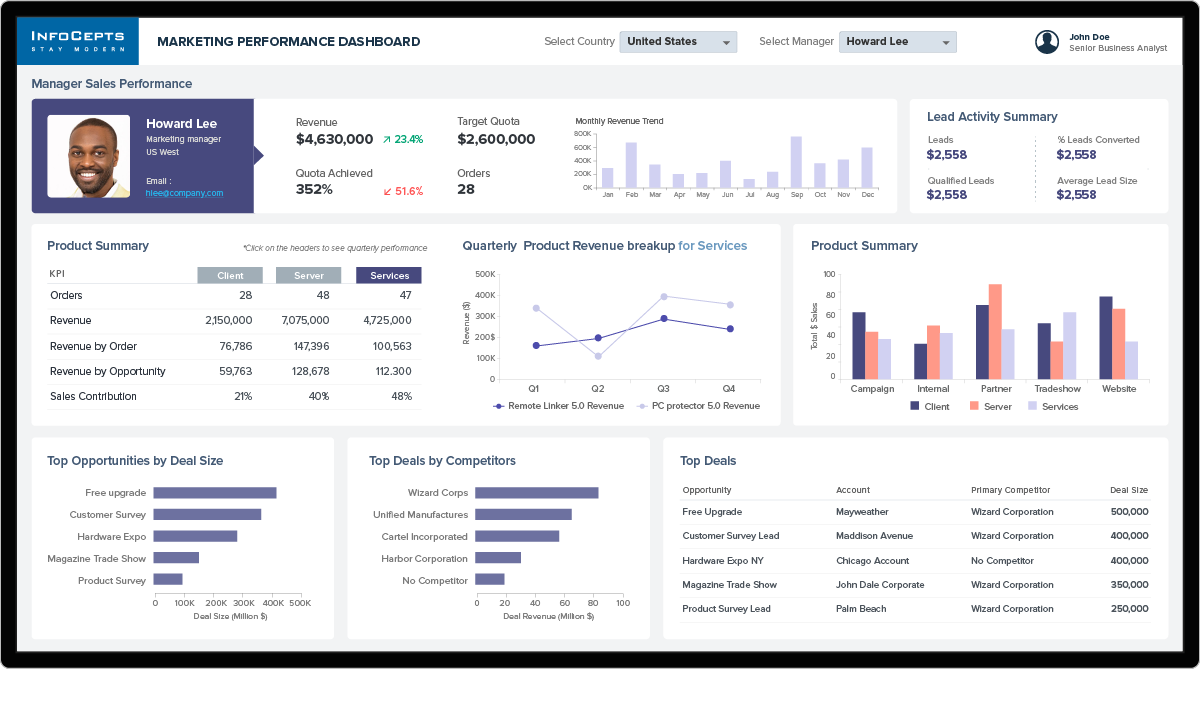
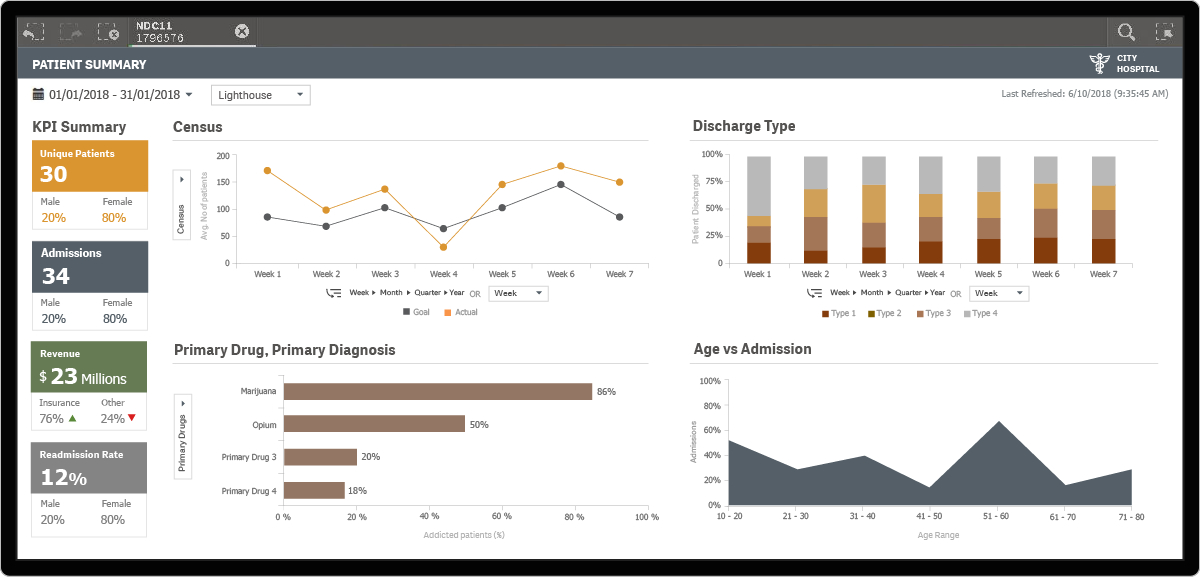
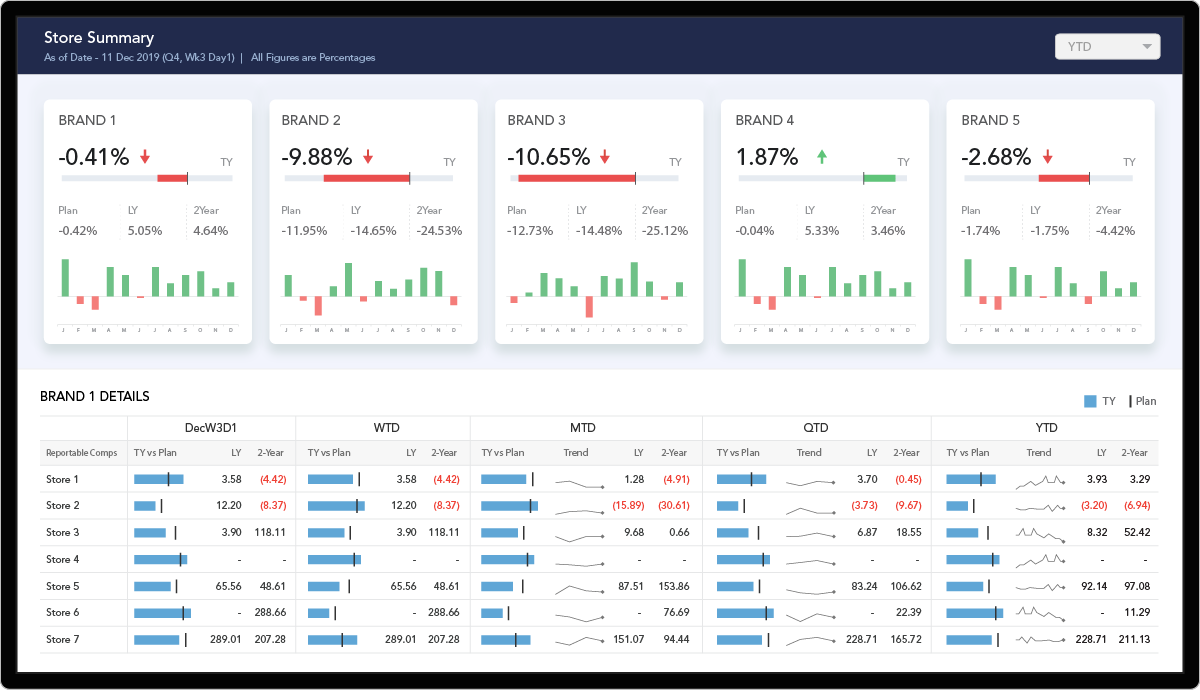
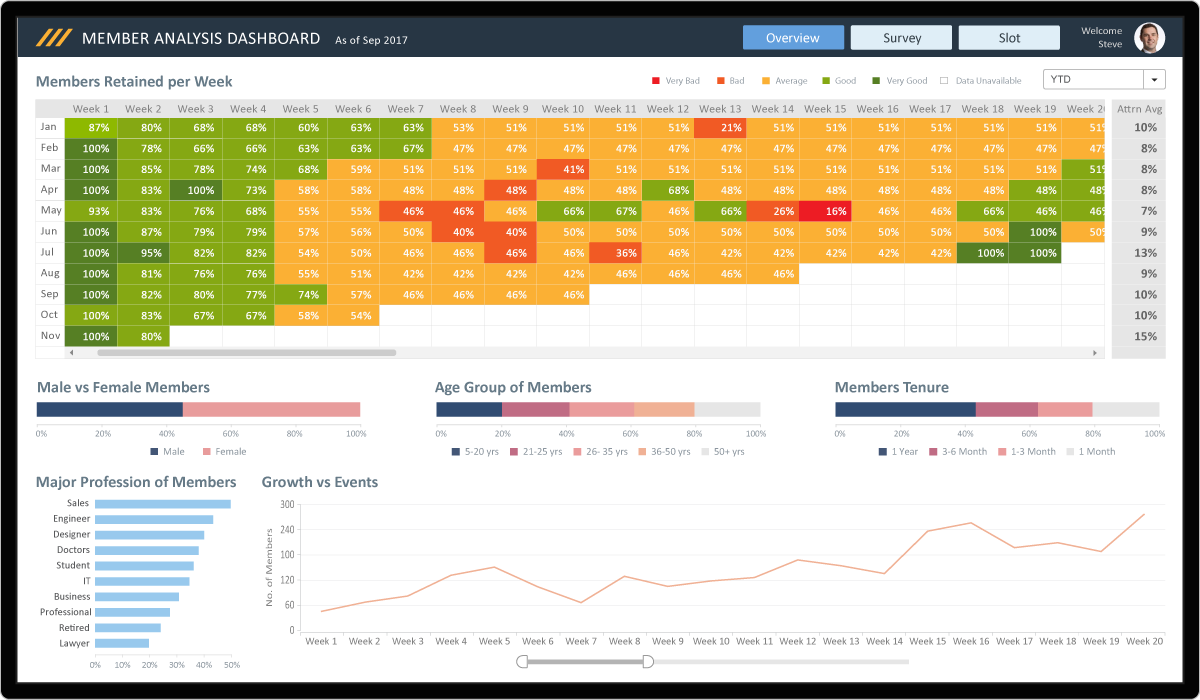
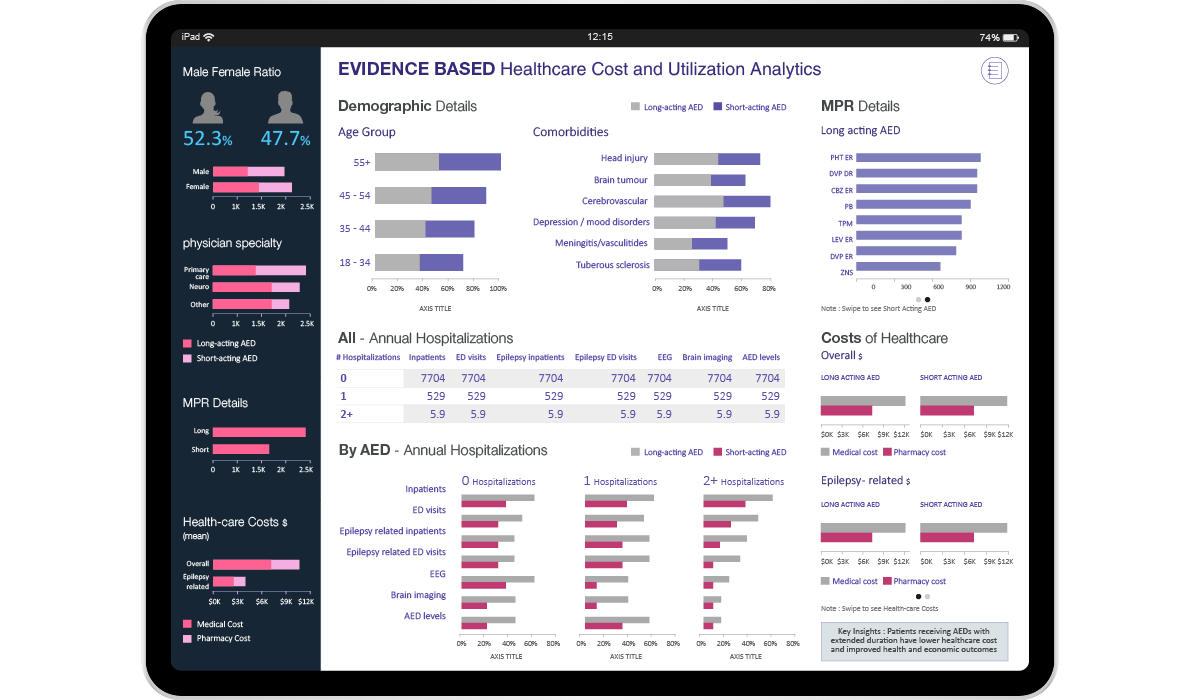
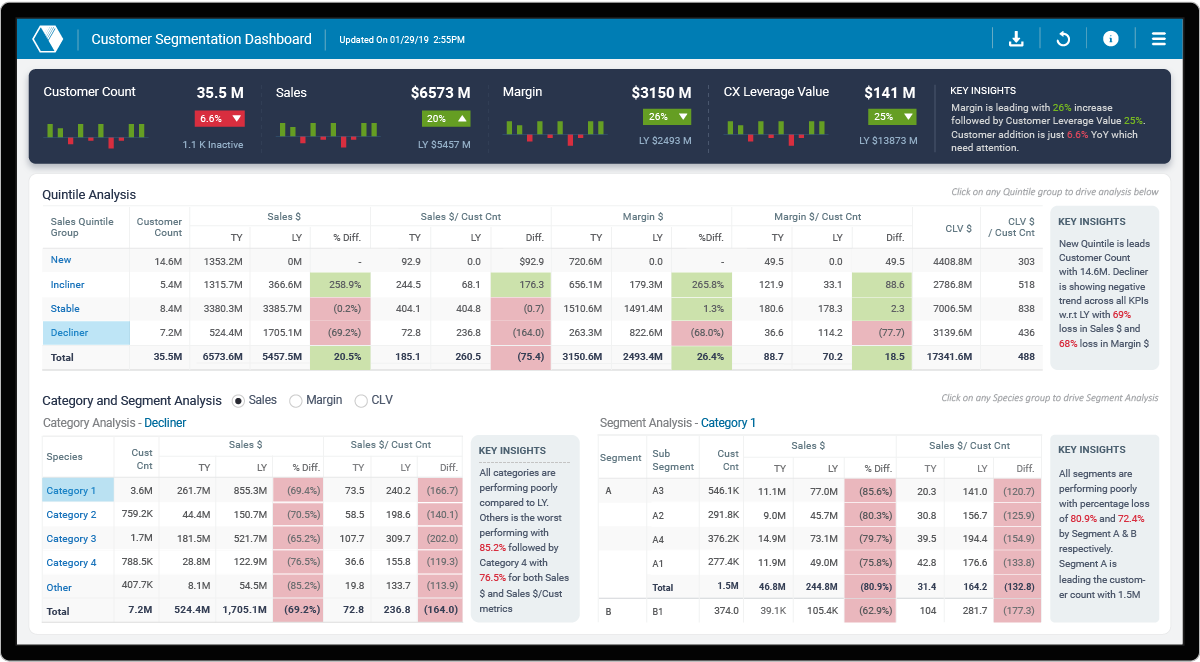
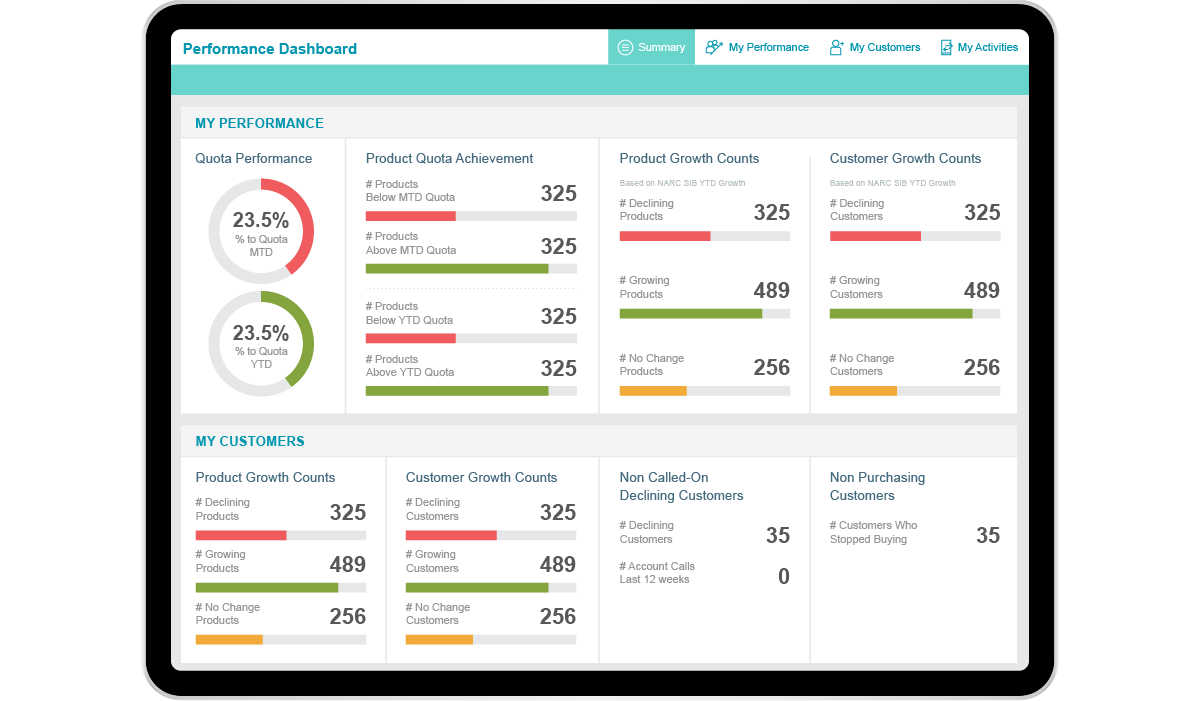
- Crisp summary on the total customer count – existing and new, demographic analysis based on gender, age, and groups which helped the authorities focus on the larger customer segment and create attractive campaigns for them and thus increase revenue
- Detailed analysis of customer carting, action, interaction which give insights on customer behavior
- Shopper counts at a given moment graph helped in understanding heavy rush days and preparation for it accordingly
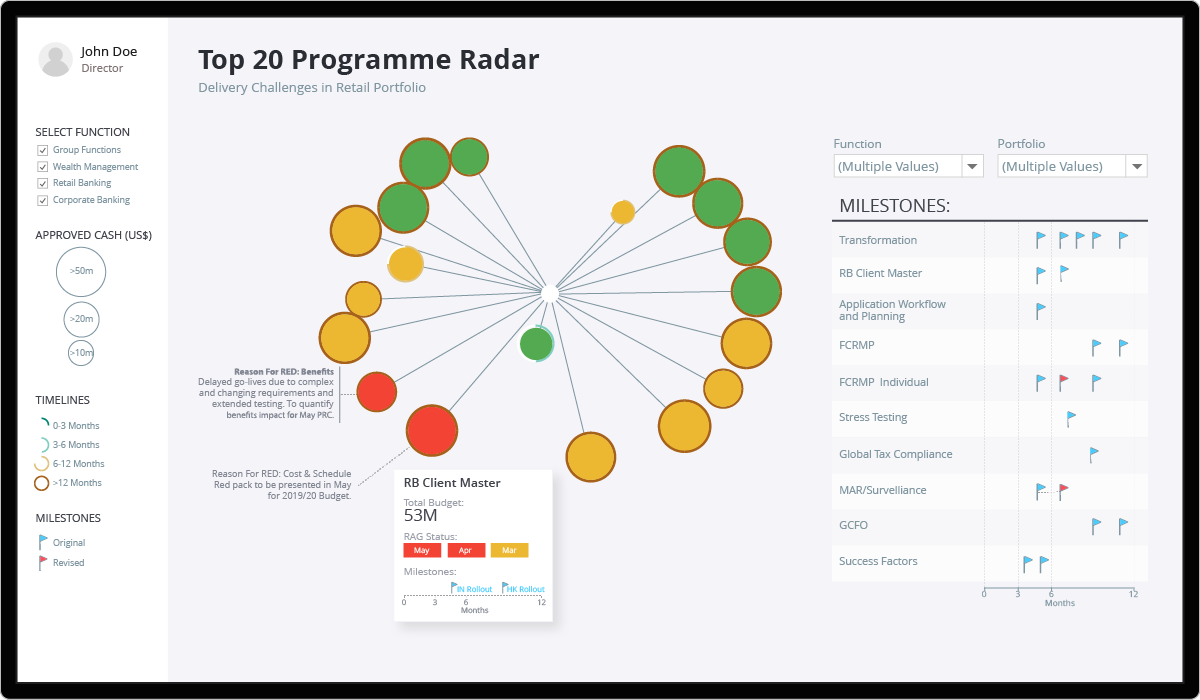
- A network graph which shows details about preferred entry and exit gates for customers which can be well utilized for marketing campaigns and making sure services around them are up to the mark
Reduced time to customer insights
Increased efficacy of marketing campaigns
Increased customer retention rate
Manhours saved /week

