


Technology
Power BI
Industry Retail
Platform Web Dashboard
CapabilitiesData Storytelling Design Thinking
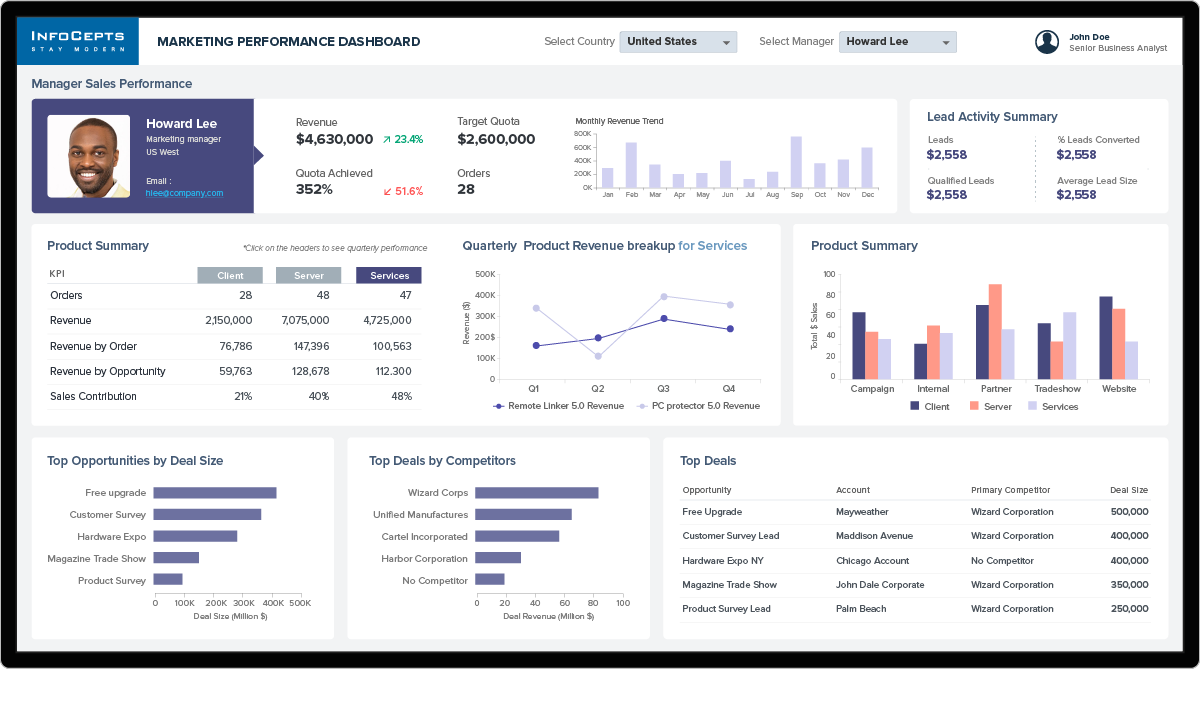
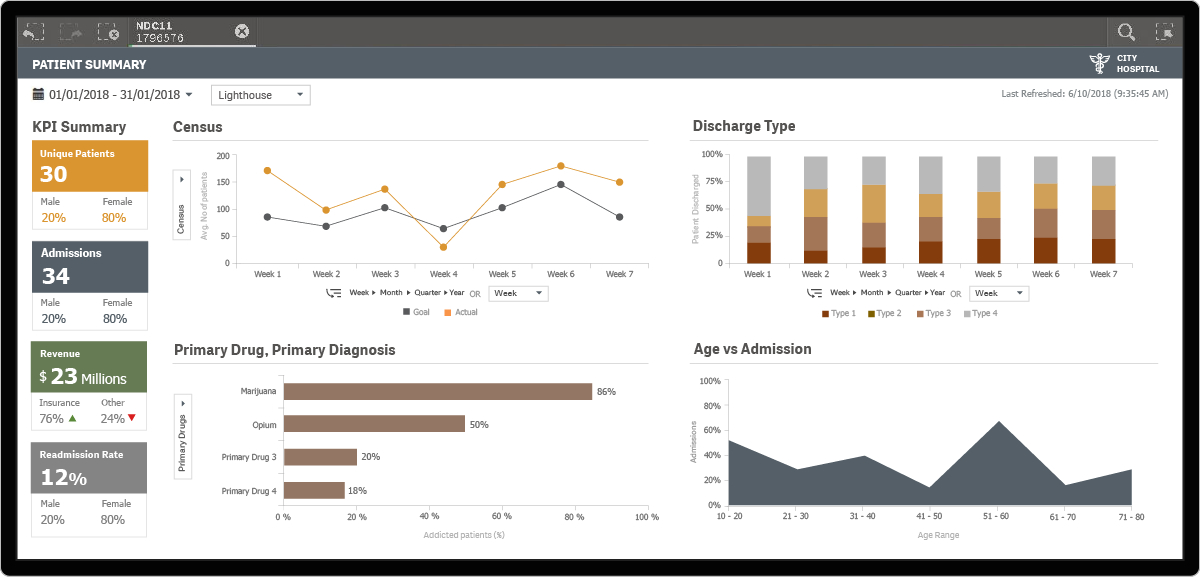
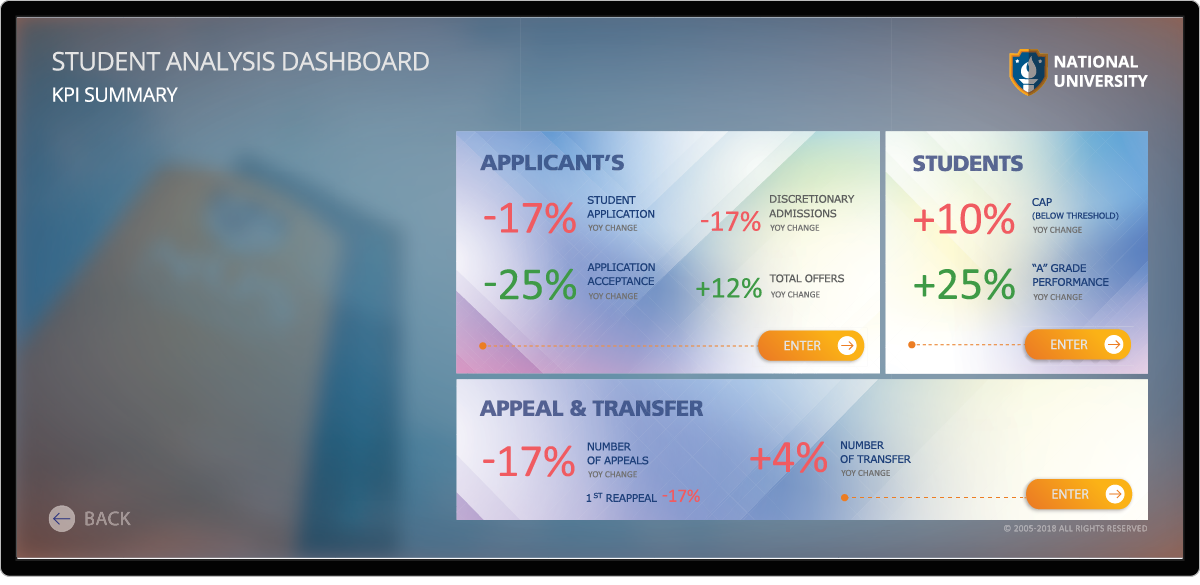
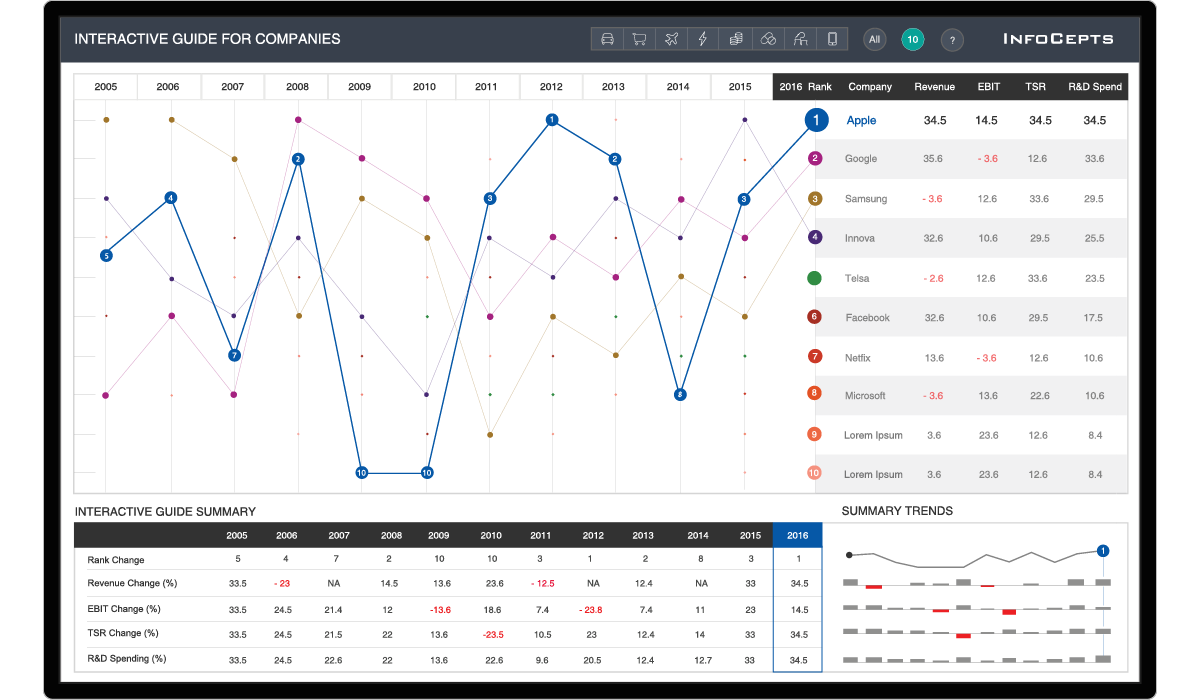
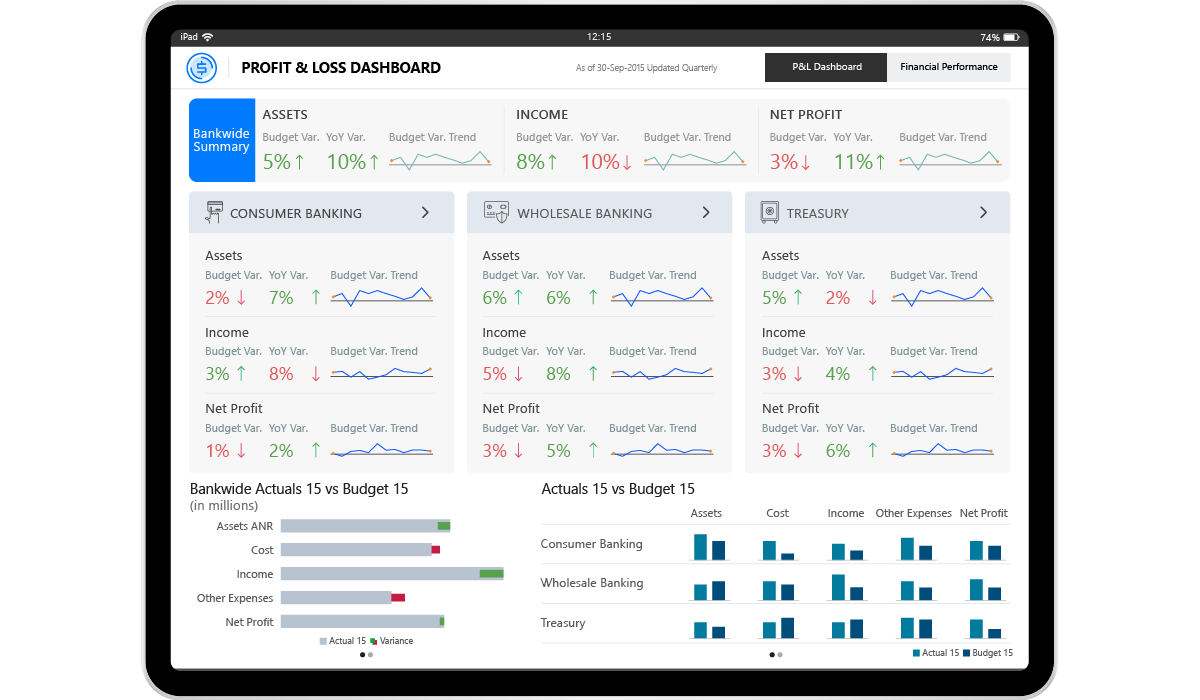
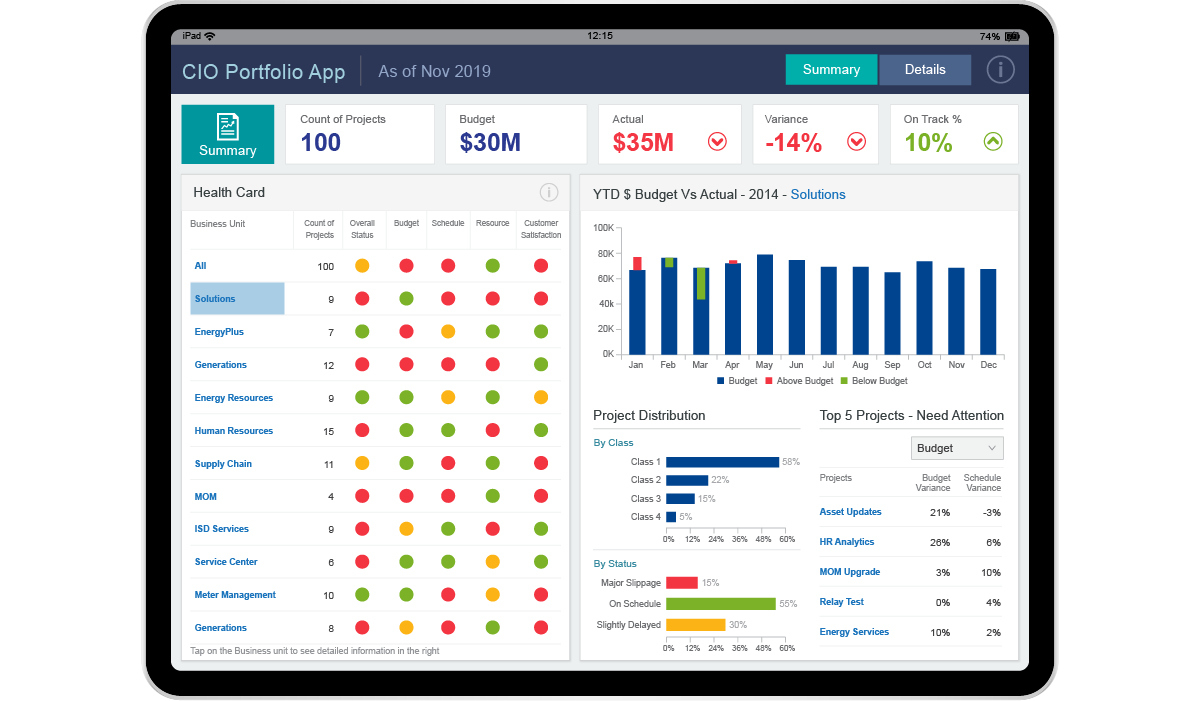
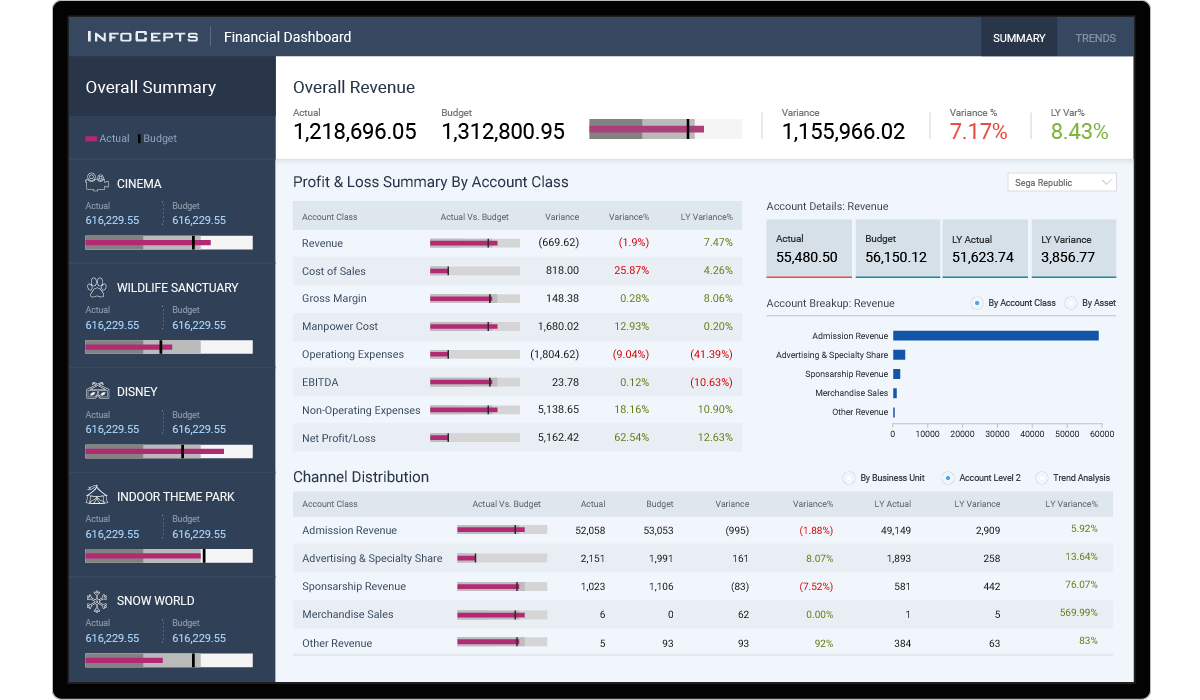
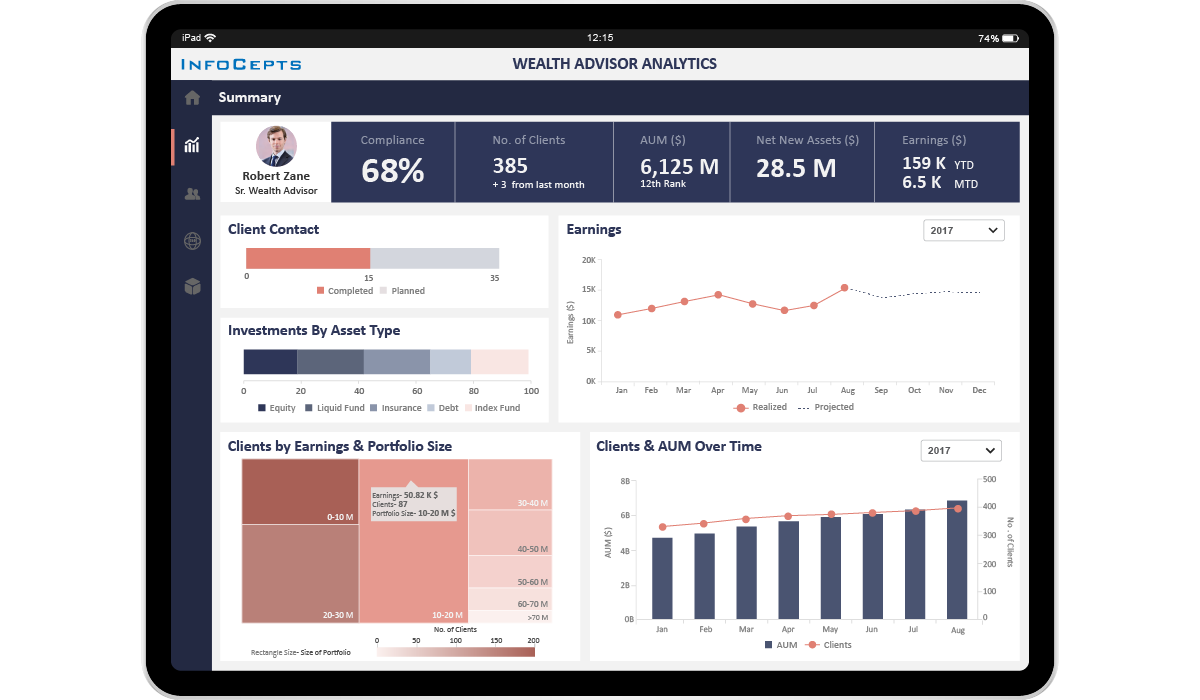
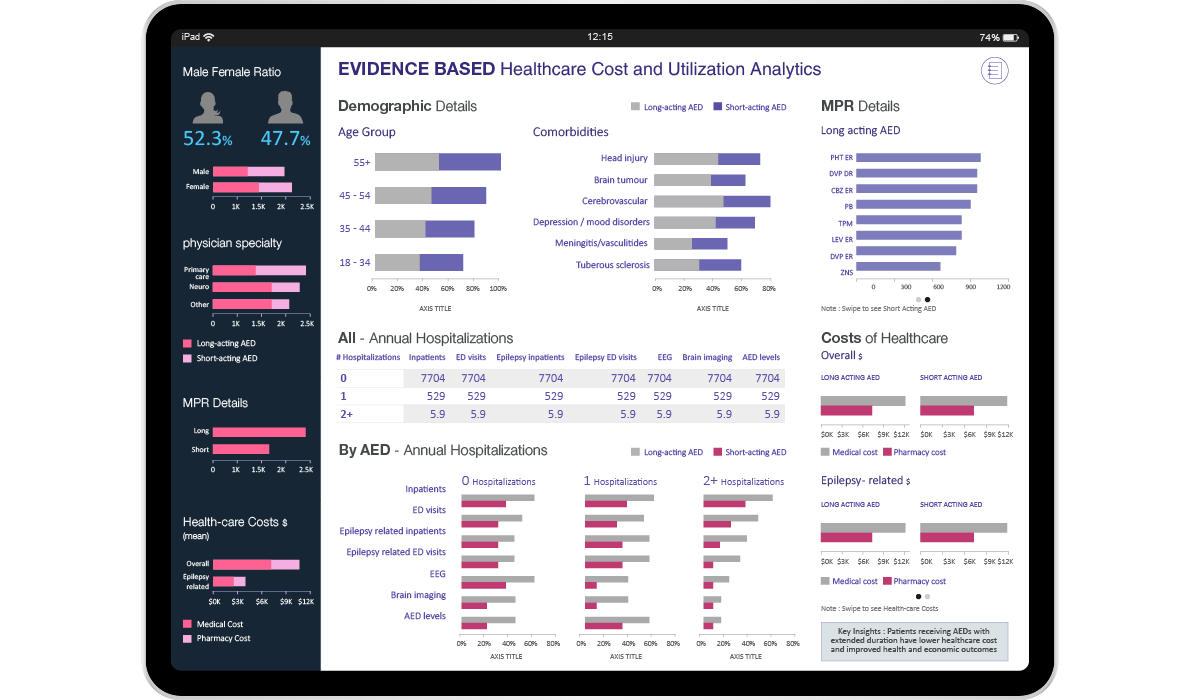
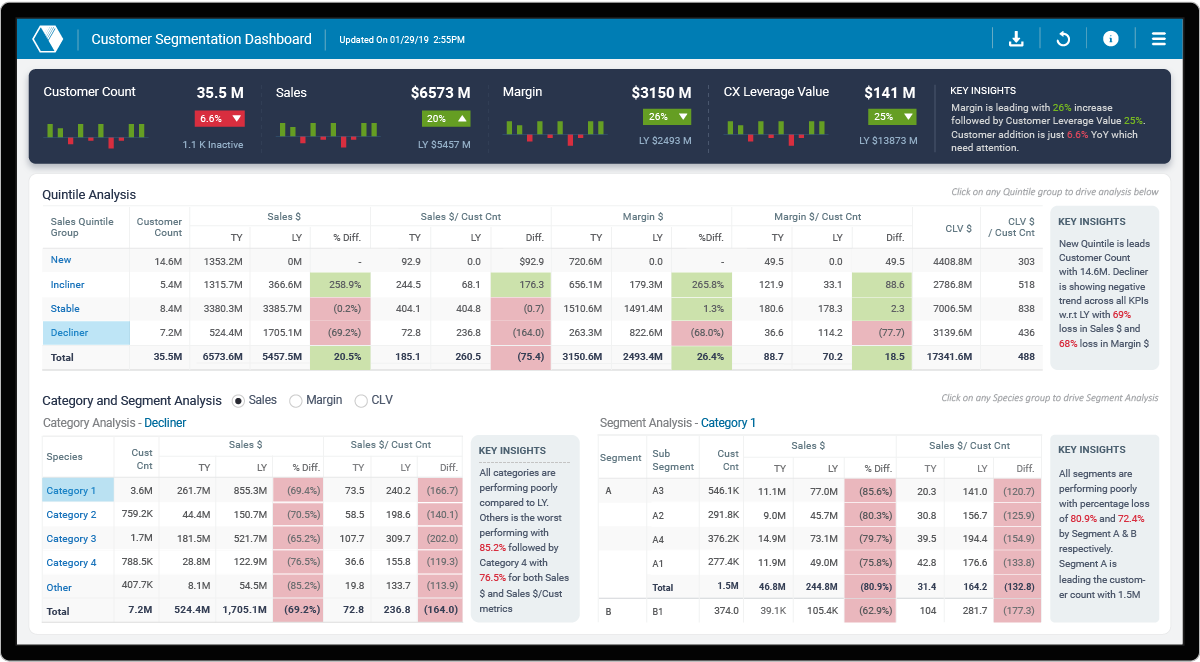
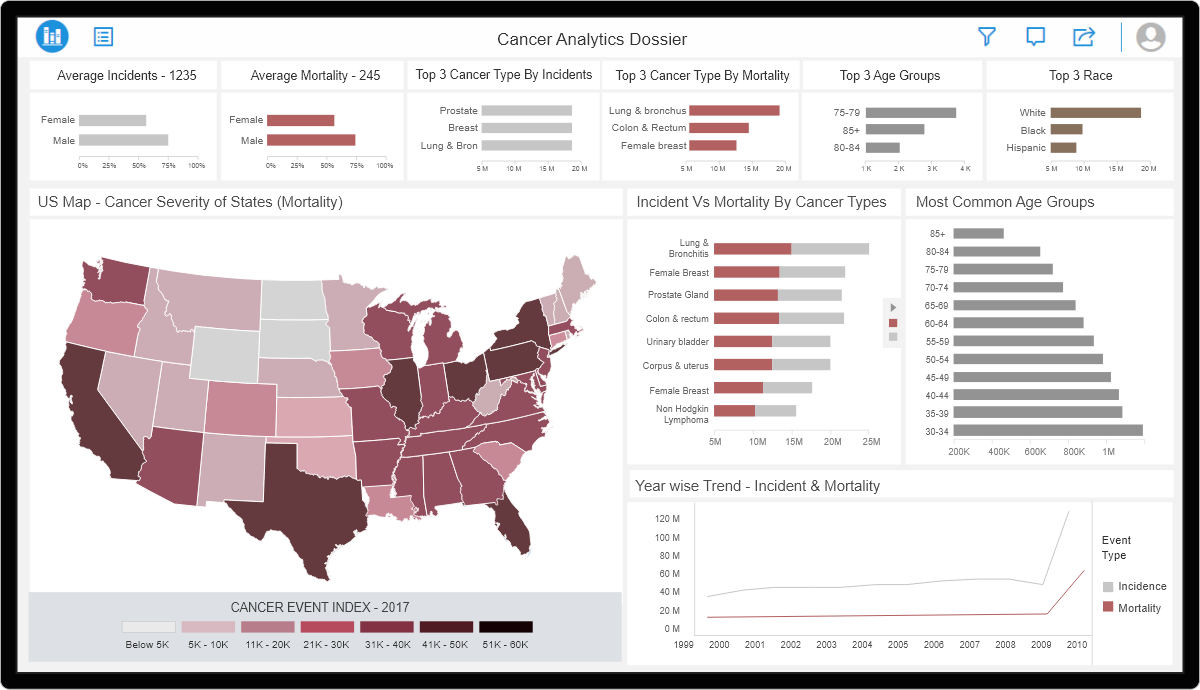
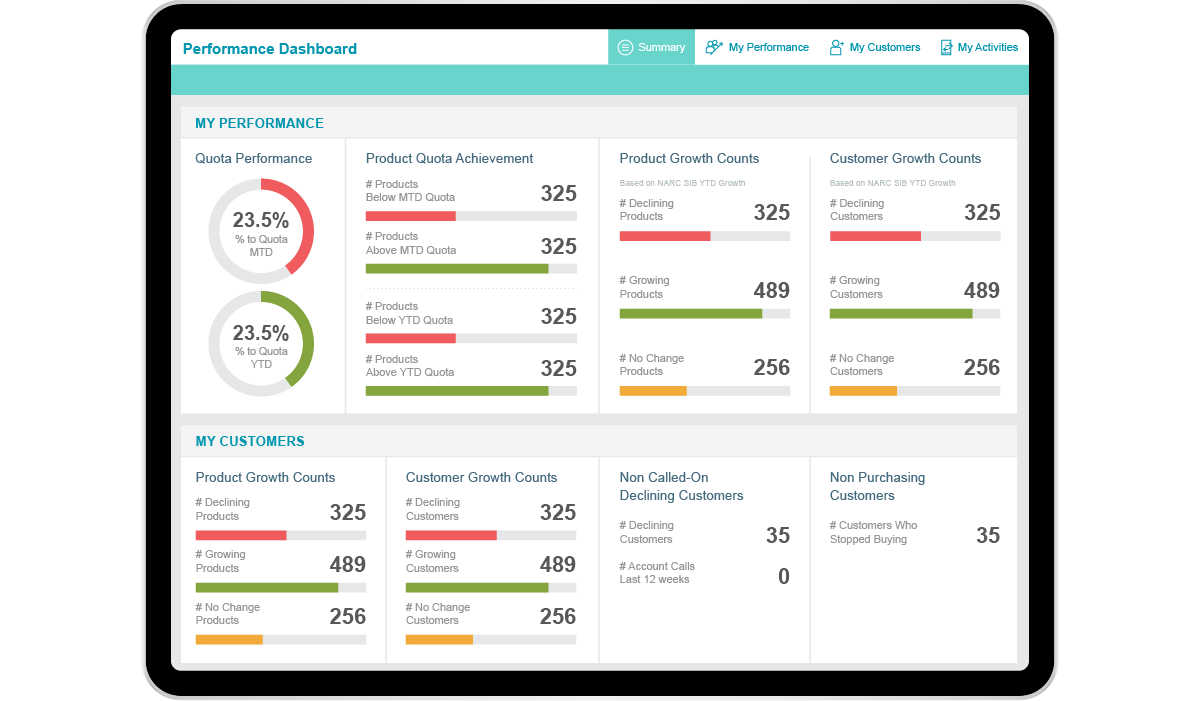
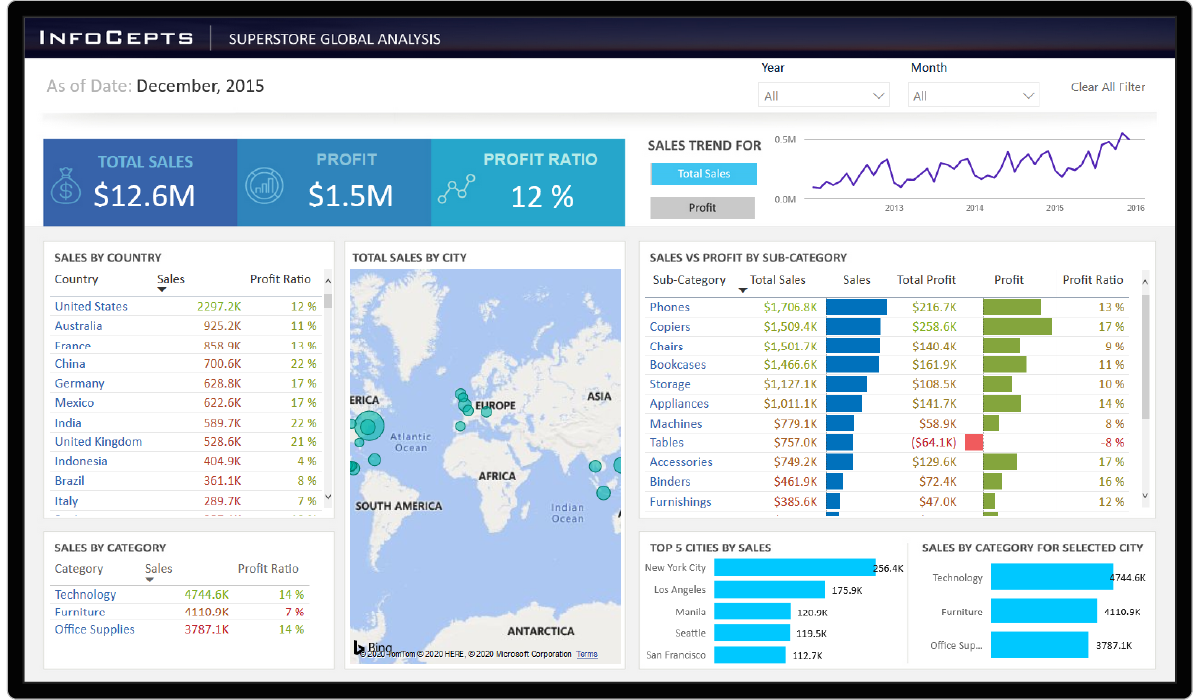
Explore this dashboard which provides a 360-degree view of overall store sales performance. For analysis, users can use the dashboard to quickly check KPIs, broken down by different segments. This dashboard created was created by InfoCepts’ Data Visualization showcases use of visualization, application of data visualization best practices, and highlights vital information enabling users to take quick decisions.
Challenges
- Identifying key KPIs to gain better insights from the data
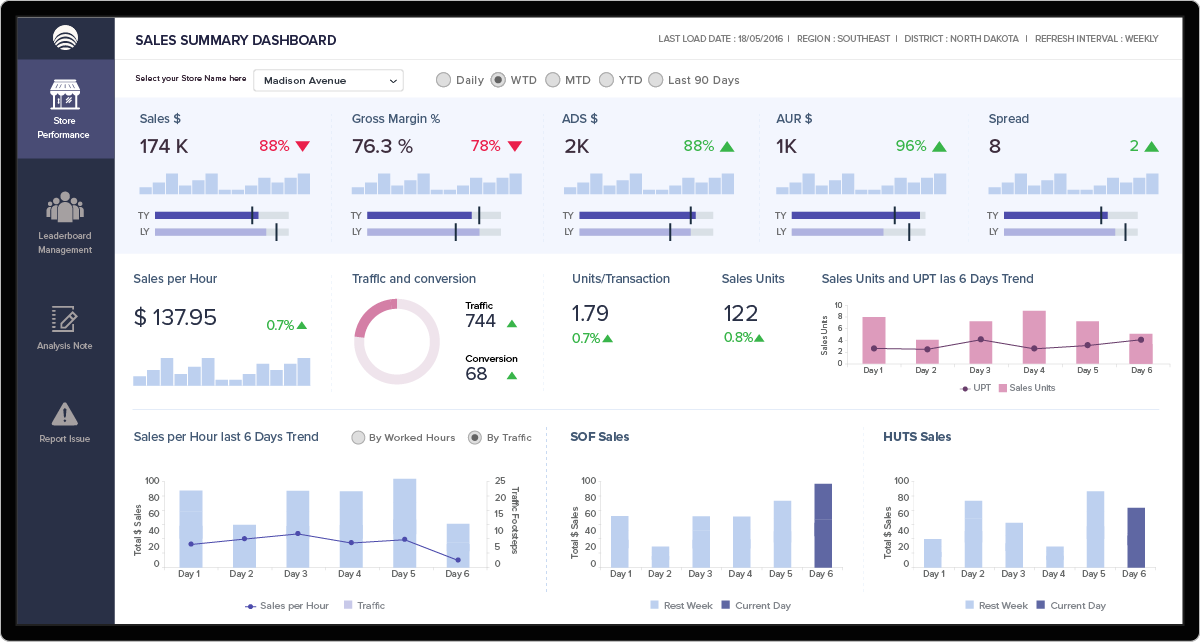
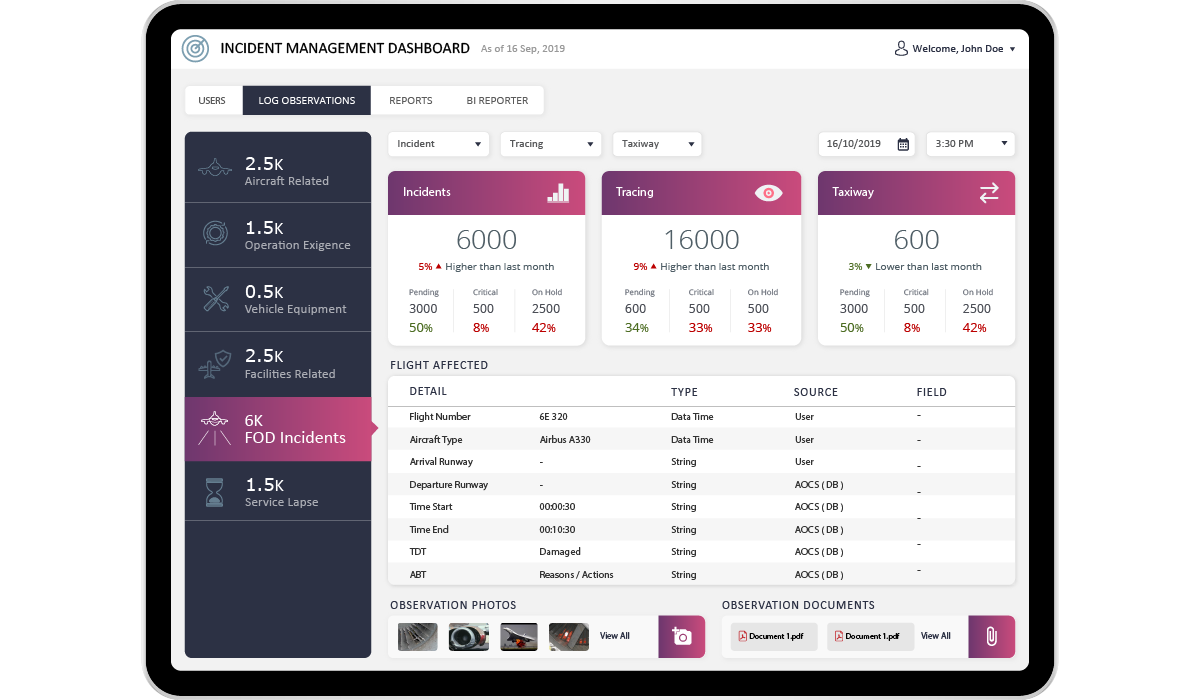
- A centralized application to provide all information in one view
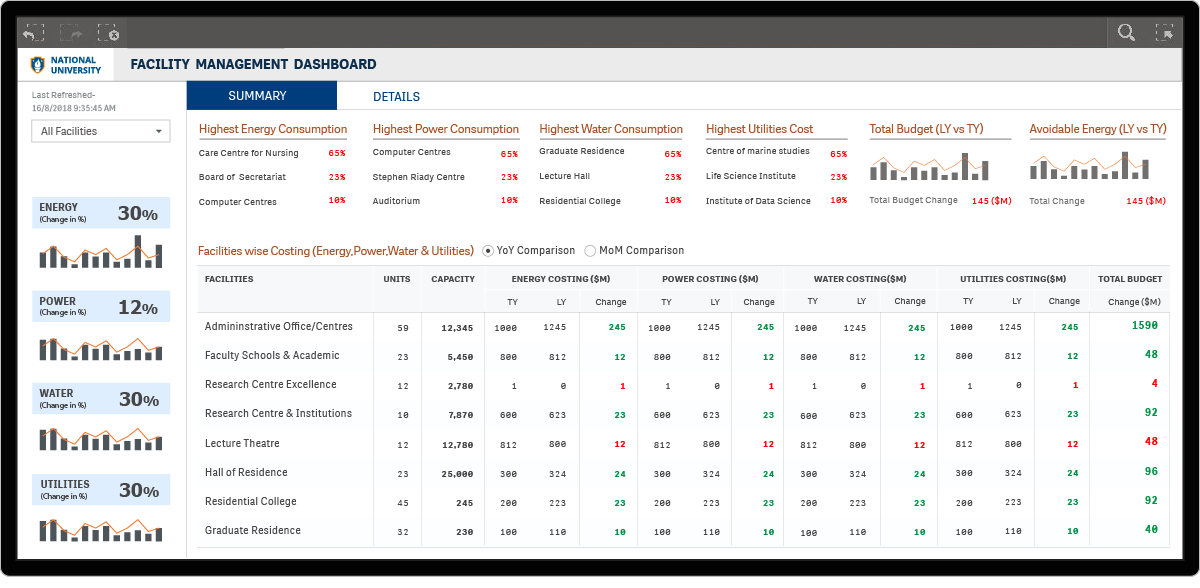
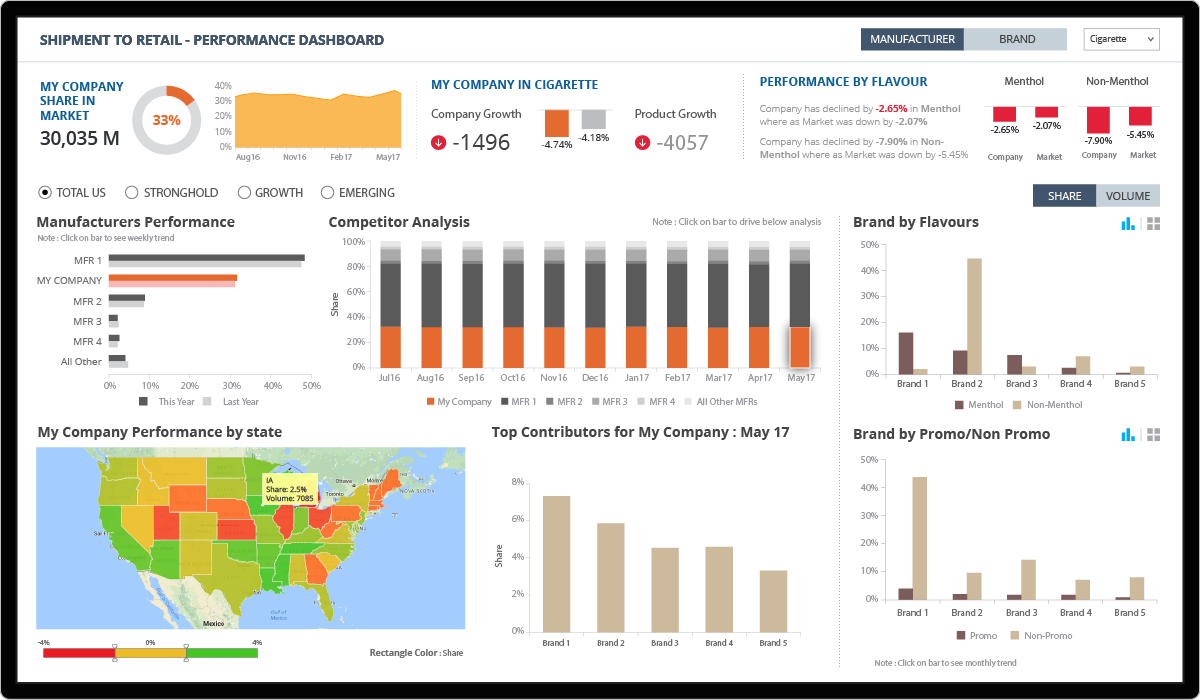
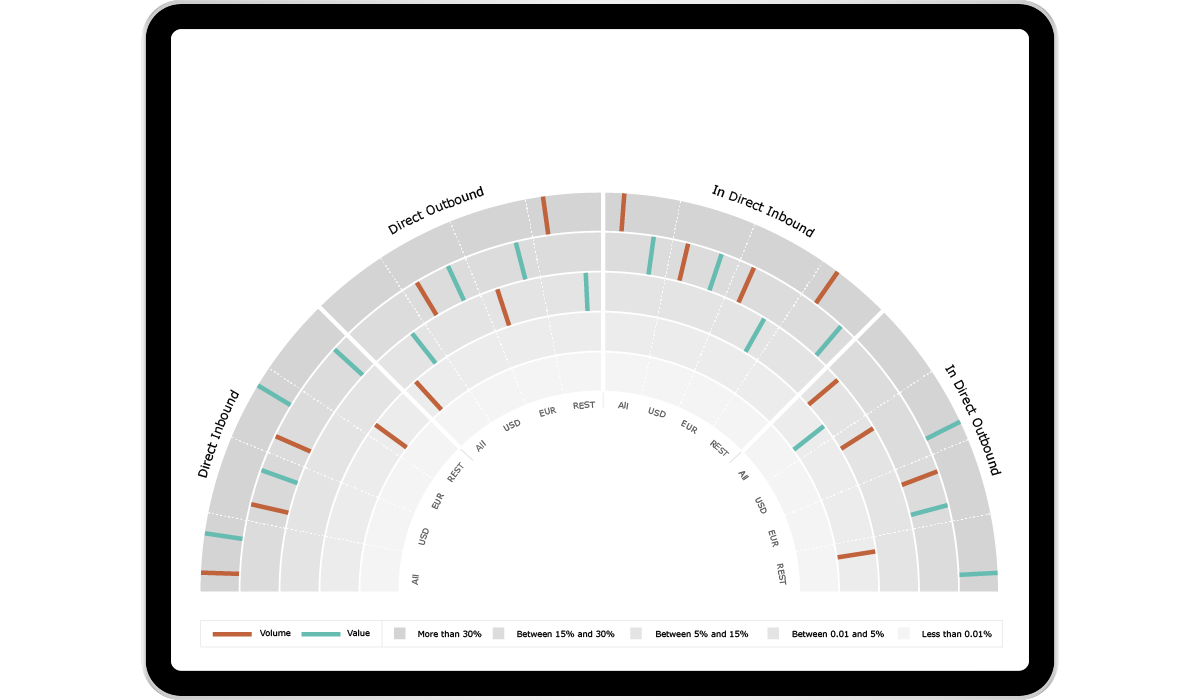
- Performing sales analysis across various attributes such as countries, cities, products, sub-categories
- Creating a comprehensive view of the overall performance of the store
Solution
- A quick summary of the total sales, profit and profit ratio, and sales trend by year, giving a concise view of store performance annually
- Users can view both high level and detailed analyses of information on a single-screen display
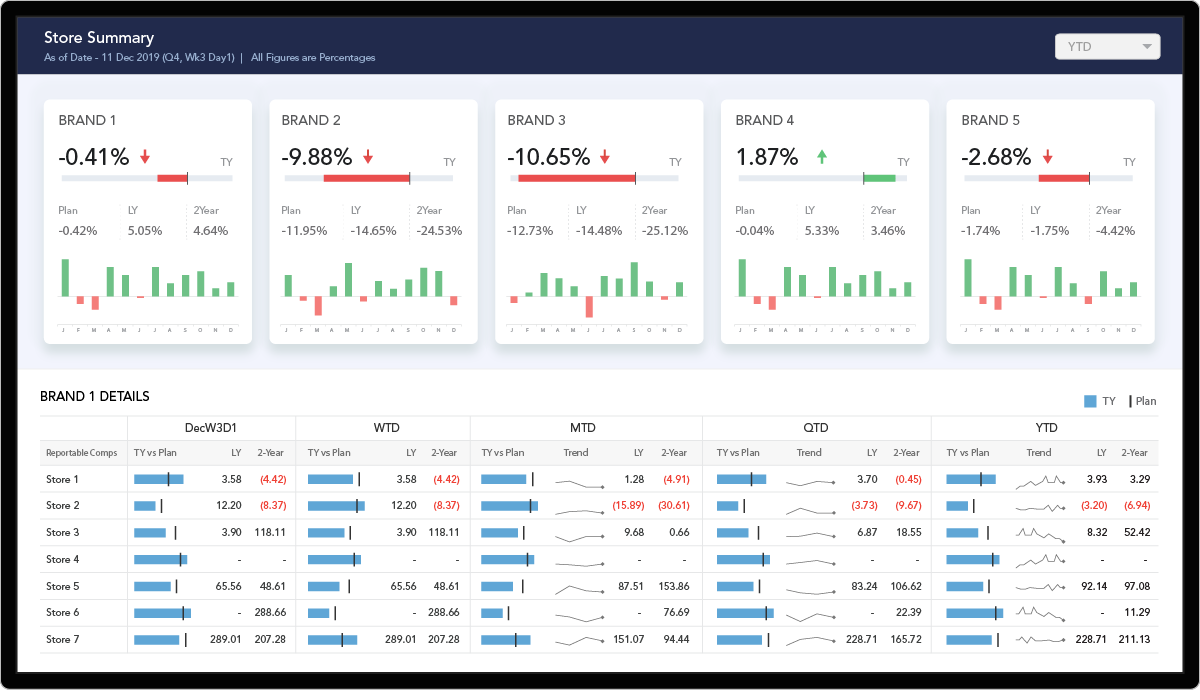
- Comparison of sales and profit within subcategories to analyze product performance
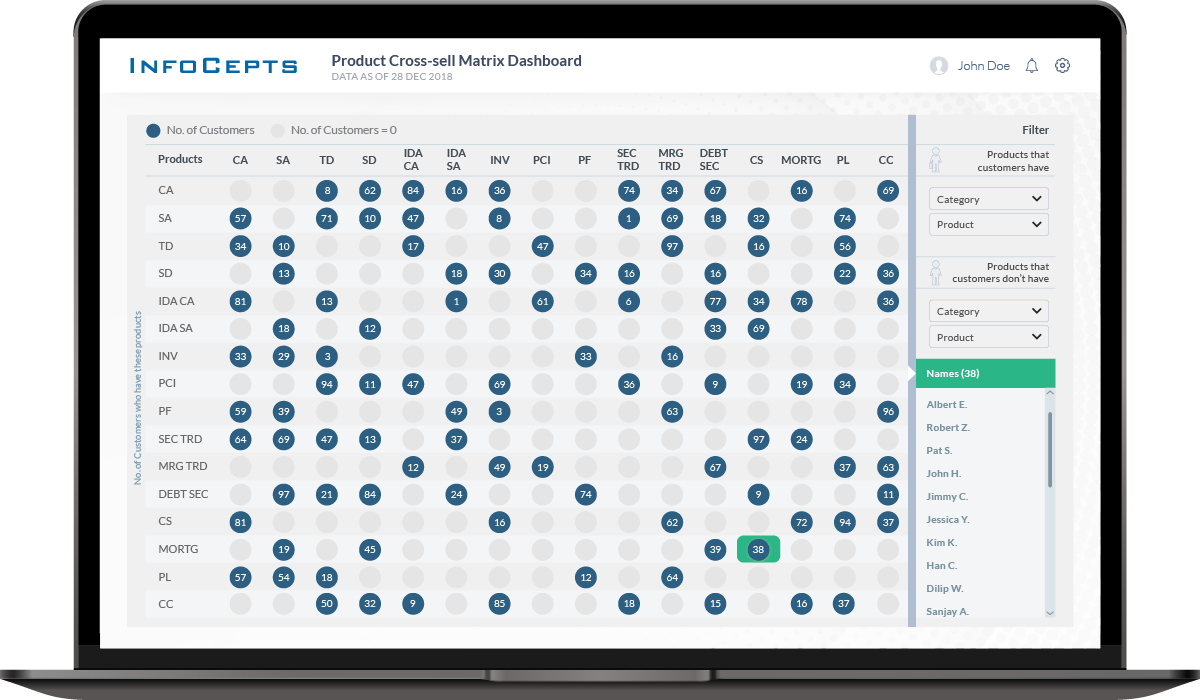
- Detailed level information on each visualization at a granular level helping the user to make better decisions and gain actionable insights
+50%
Increase in User Adoption by store managers
+64%
Increased in sales
+56%
Improved decision making
+45%
Ease of use

