


Technology
MicroStrategy
Industry BFSI
Platform Web Dashboard
CapabilitiesData Storytelling Design Thinking
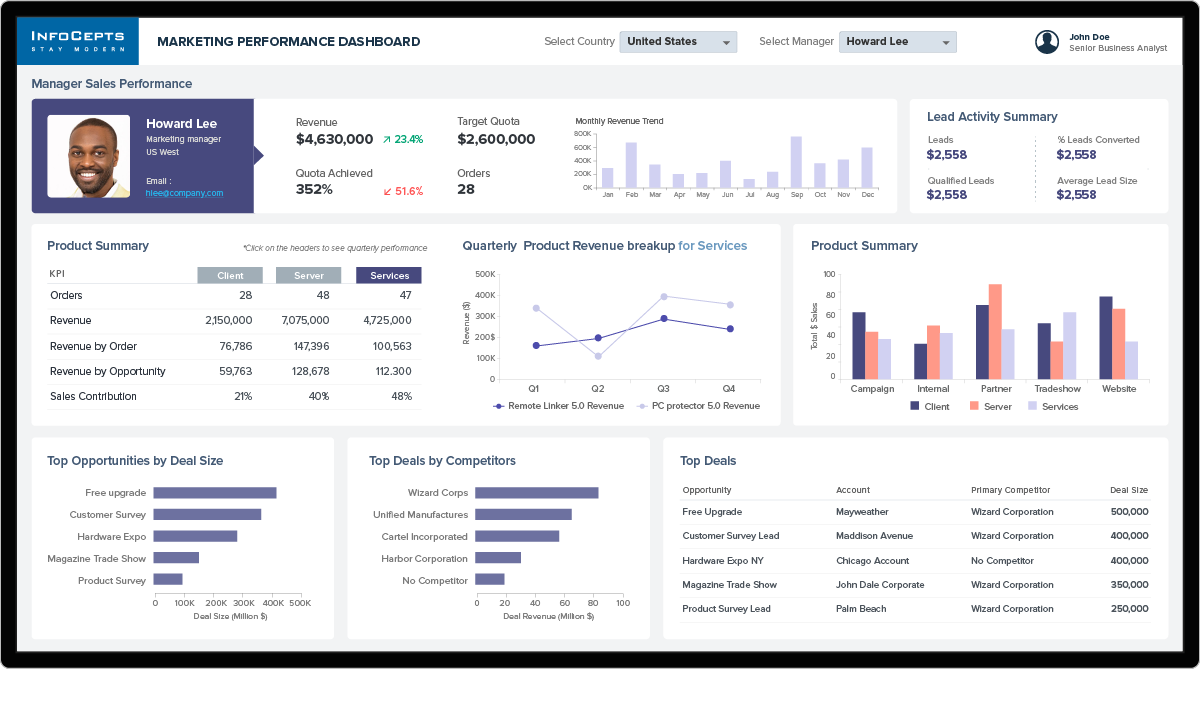
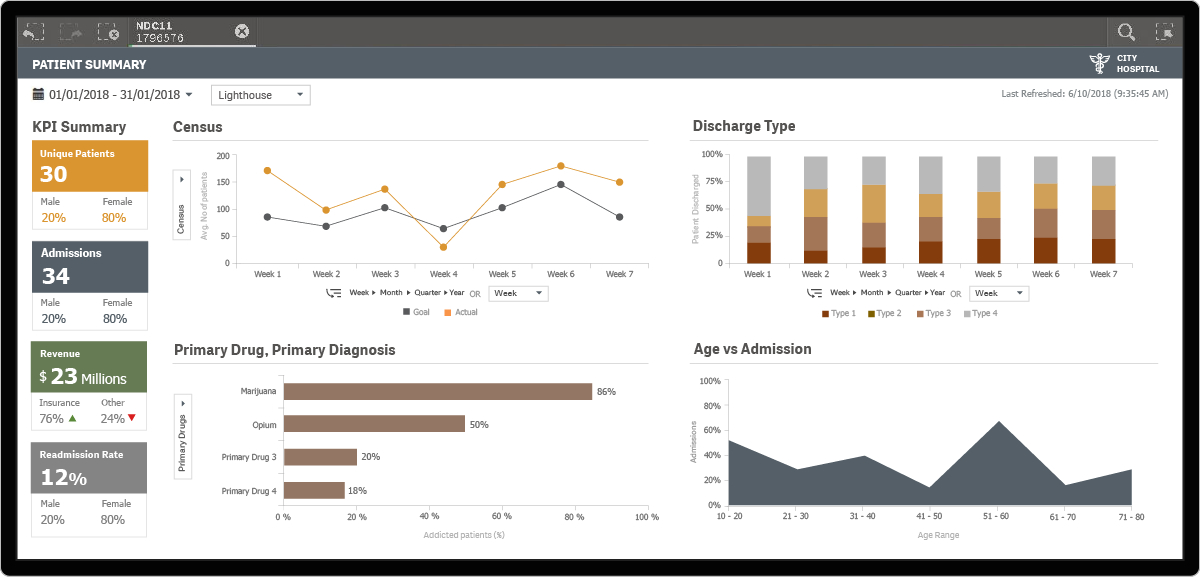
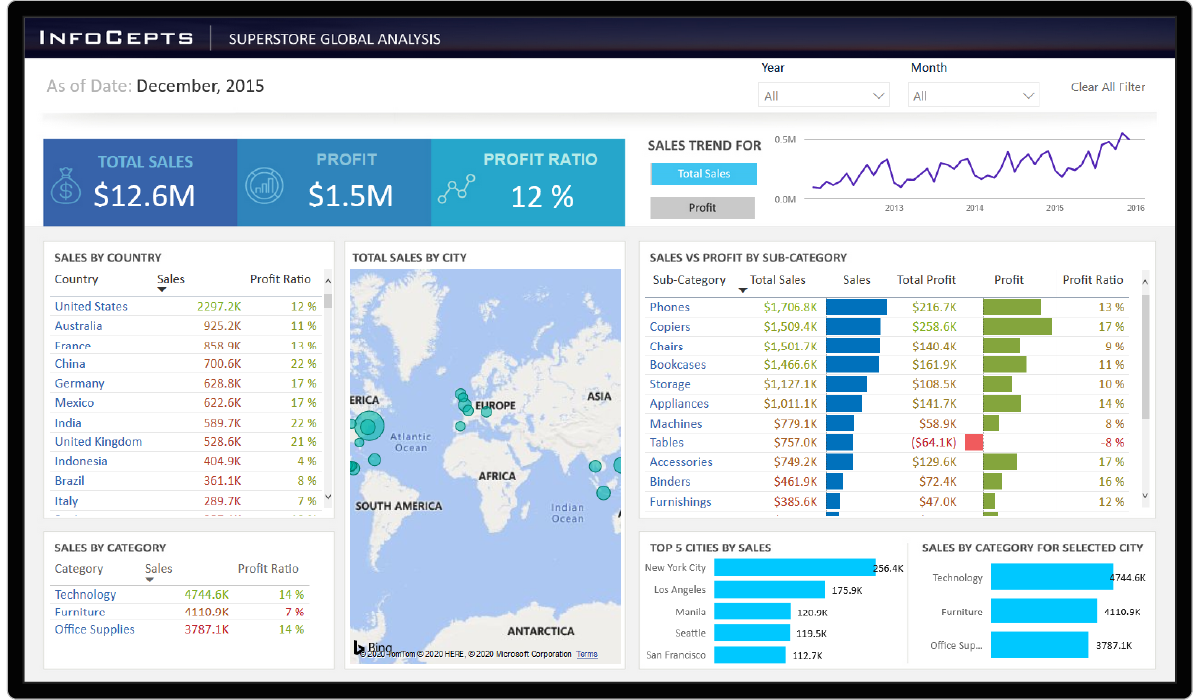
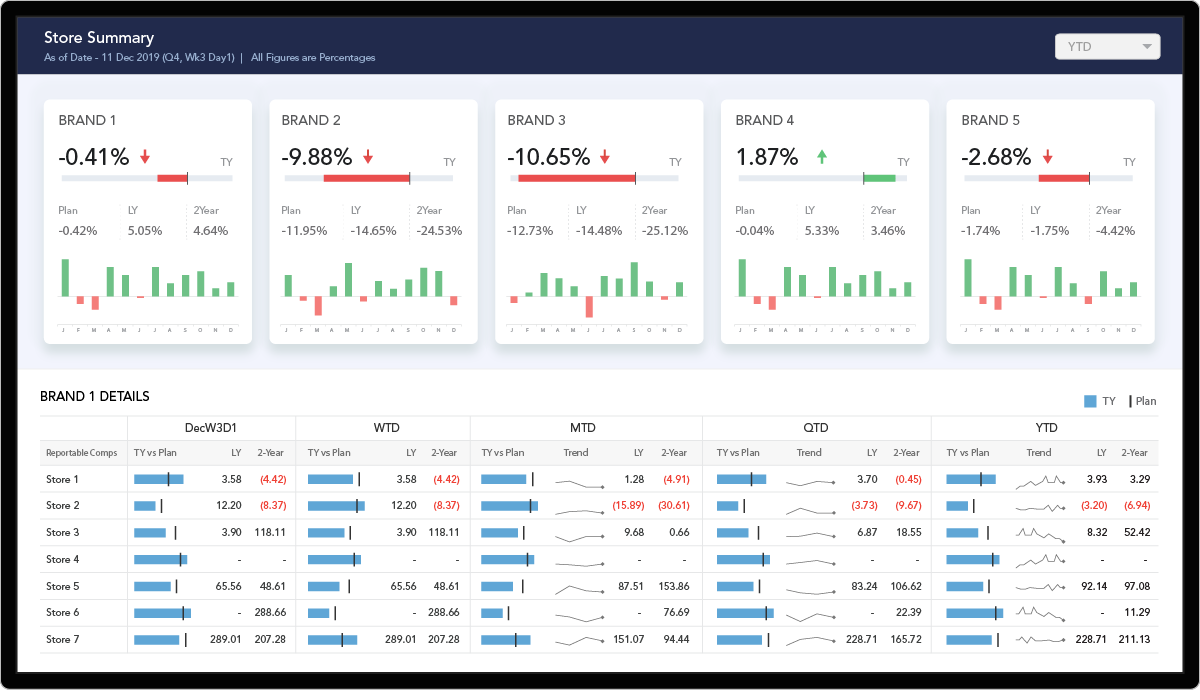
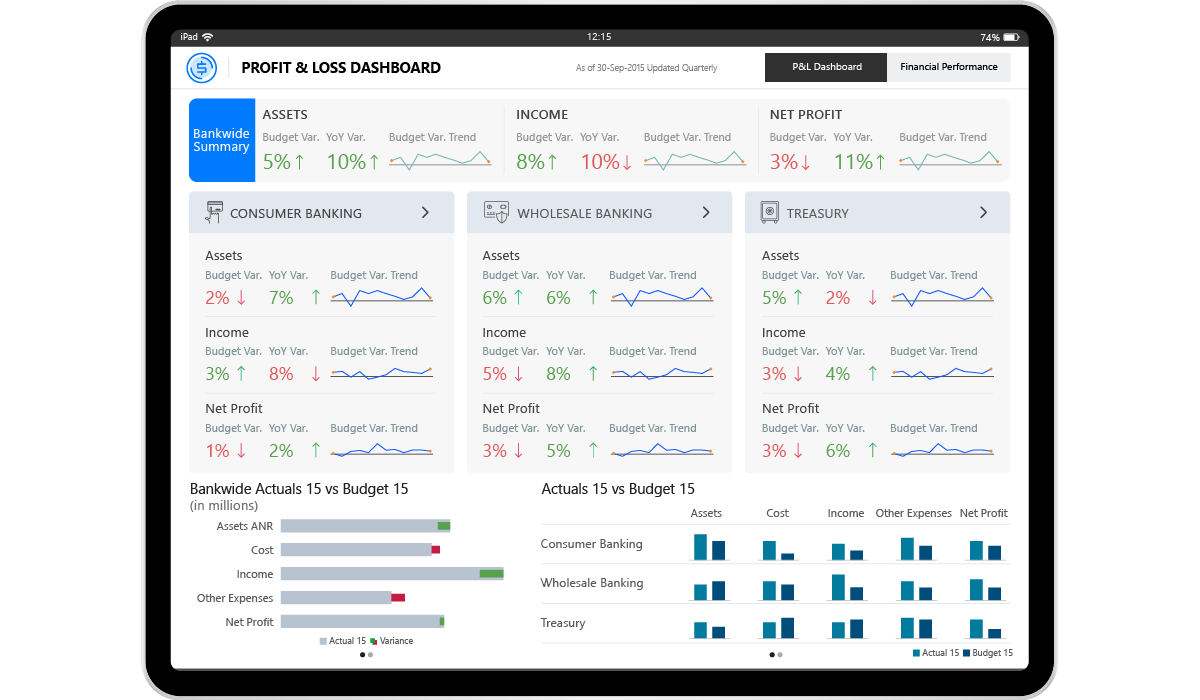
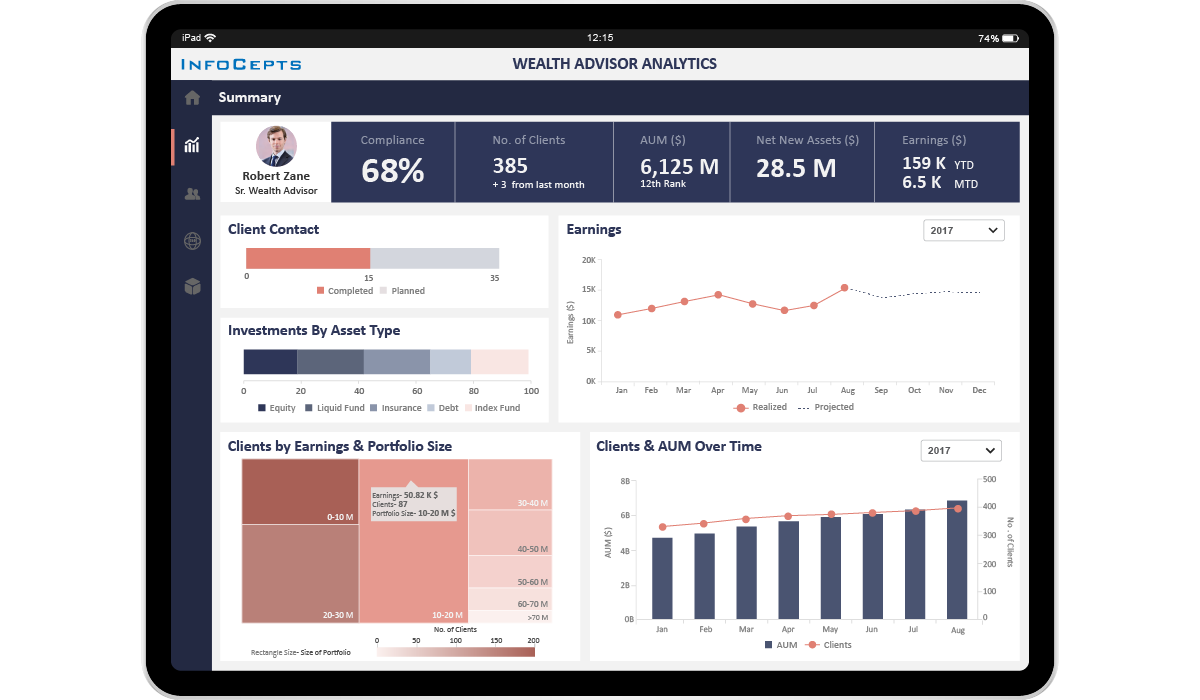
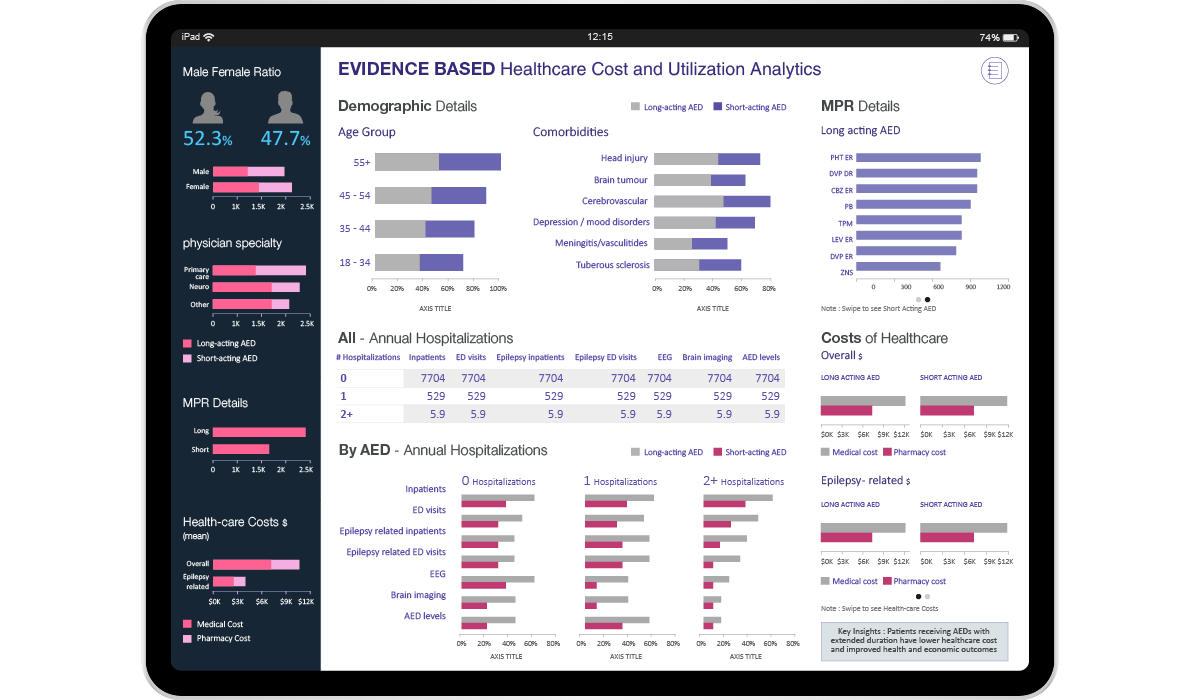
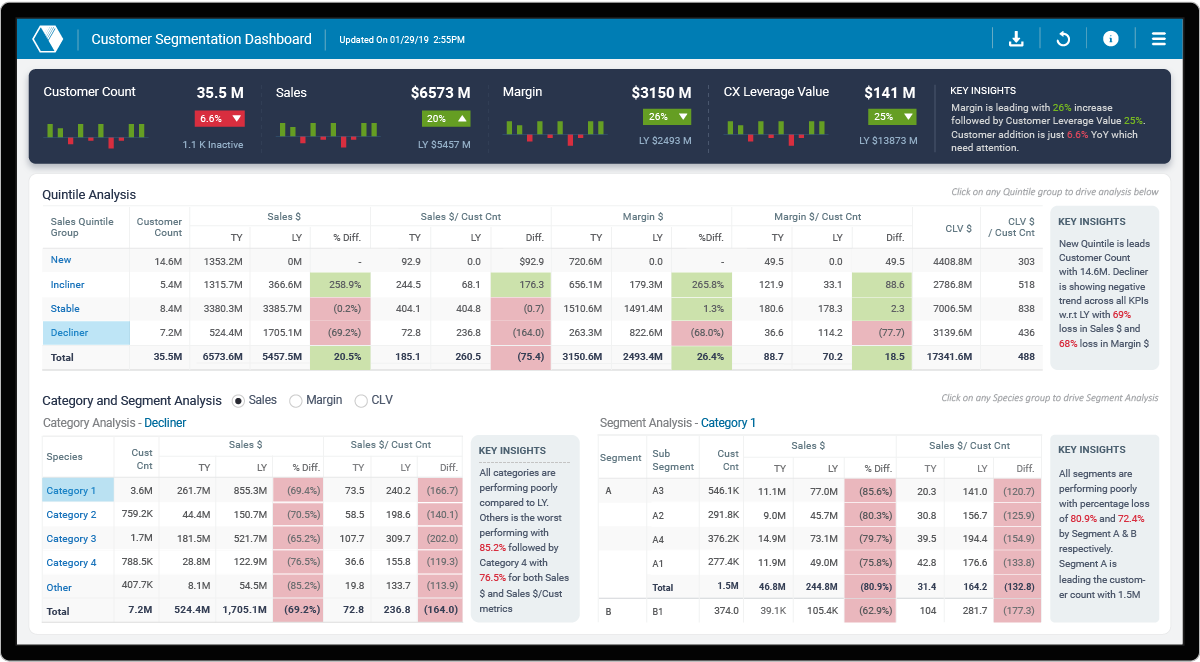
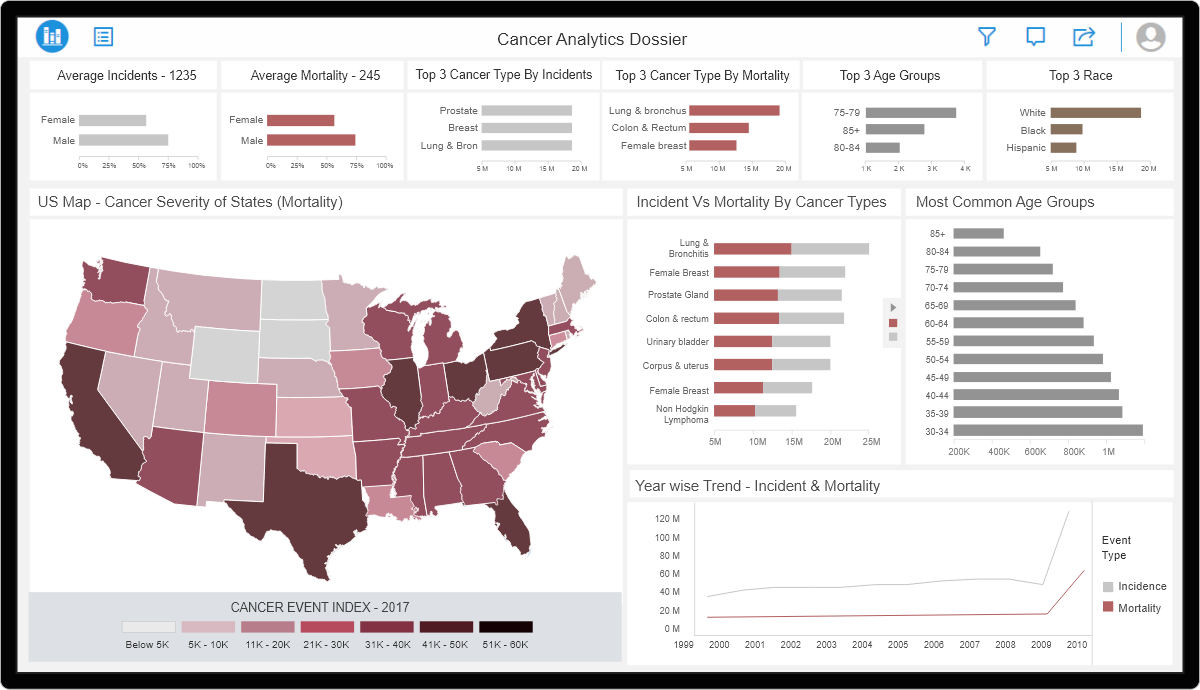
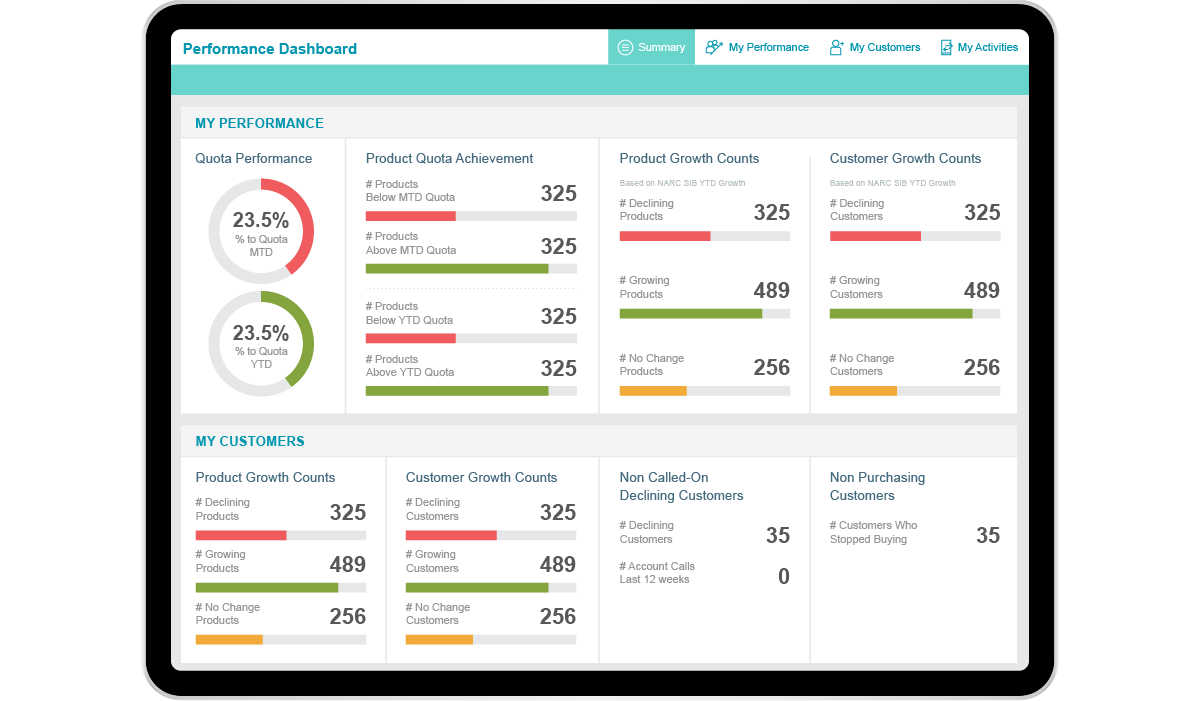
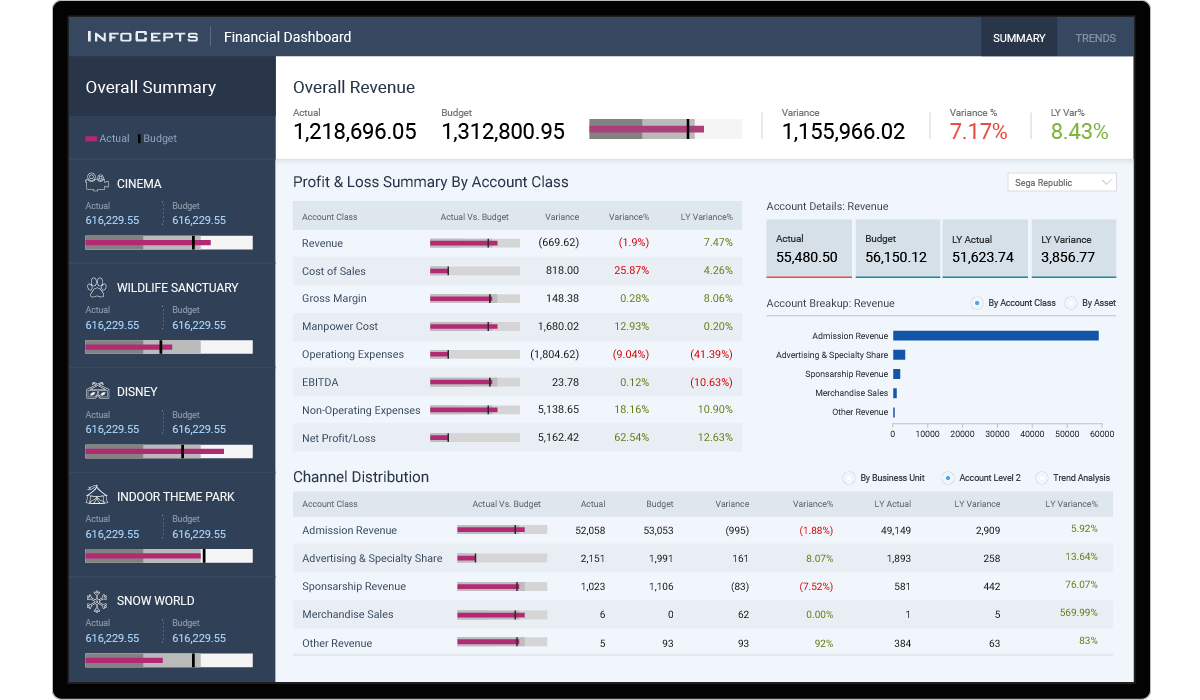
The Financial Dashboard provides users with analysis on key KPIs like Revenue, Cost of Sales, Gross Margin, Operating Expenses, etc. across different Entertainment assets. It is intended to help the management of major Entertainment conglomerate to improve and make quality decisions. The Dashboard deep-dives and provides a more detailed insight by allowing the user to drill into the data and view it at a Business unit and account level. This gives users both a summarized and detailed analysis at one glance. It provides distribution analysis across various accounts as well as trend analysis to detect patterns over a period of time.
Challenges
Analyzing financial data and taking corrective action is a major challenge faced by the Entertainment Industry.
- Lack of comprehensive analysis on Profit Loss Summary on each Account
- Lack of statistical interpretation on different segments of Entertainment Industry
- Lack of systematic bifurcation by each Account class, Assets, Channel Distribution
Solution
Solution provided by InfoCepts enabled the following capabilities to address customer challenges :
- An interactive and seamless interface that accelerated the decision-making process
- The dashboard provides analysis on key KPI’s like Revenue, Operating Expenses, Net operating Profit, etc.
- It highlights the Profit/Loss statement, variances and provides comparative analysis across last year
- It provides detailed Trend Analysis with respect to Accounts as well as Channel Distribution
- It gives us scope for variance between ‘Actual’ vs ‘Budgeted’
Reduced time to insight
Reduced maintenance and cost efforts
Precision in comparative analysis
Enhanced Operational Efficiency

