


Technology
Power BI
Industry Life Science
Platform Web Dashboard
CapabilitiesData Storytelling Design Thinking
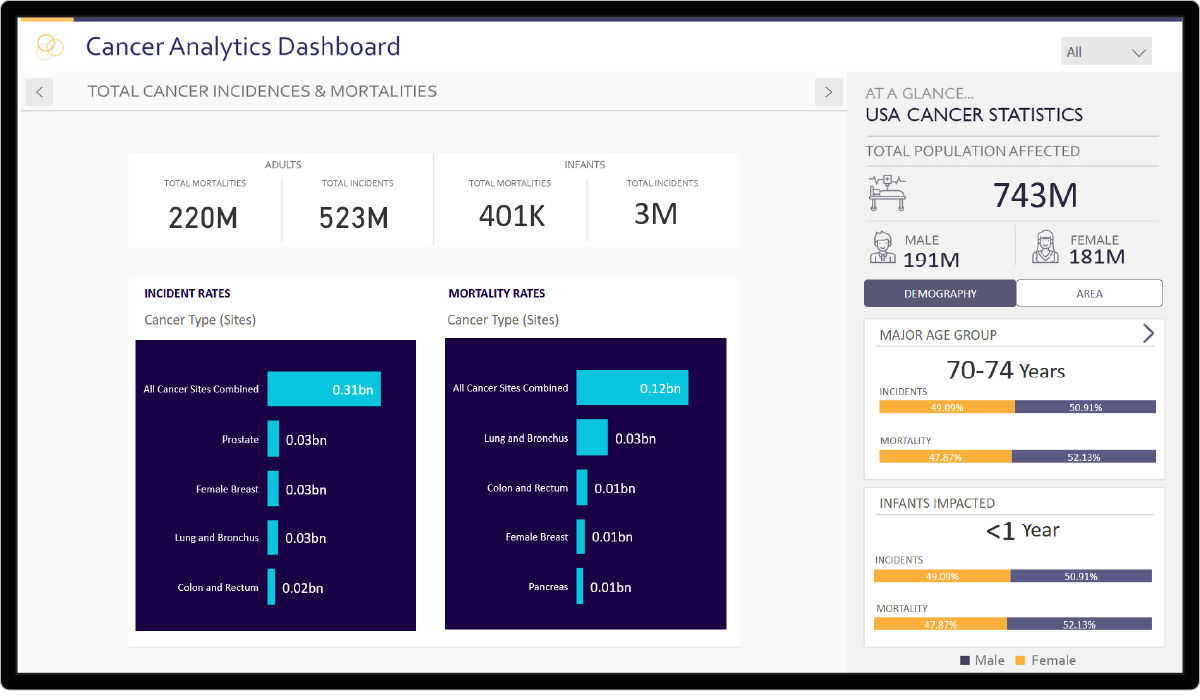
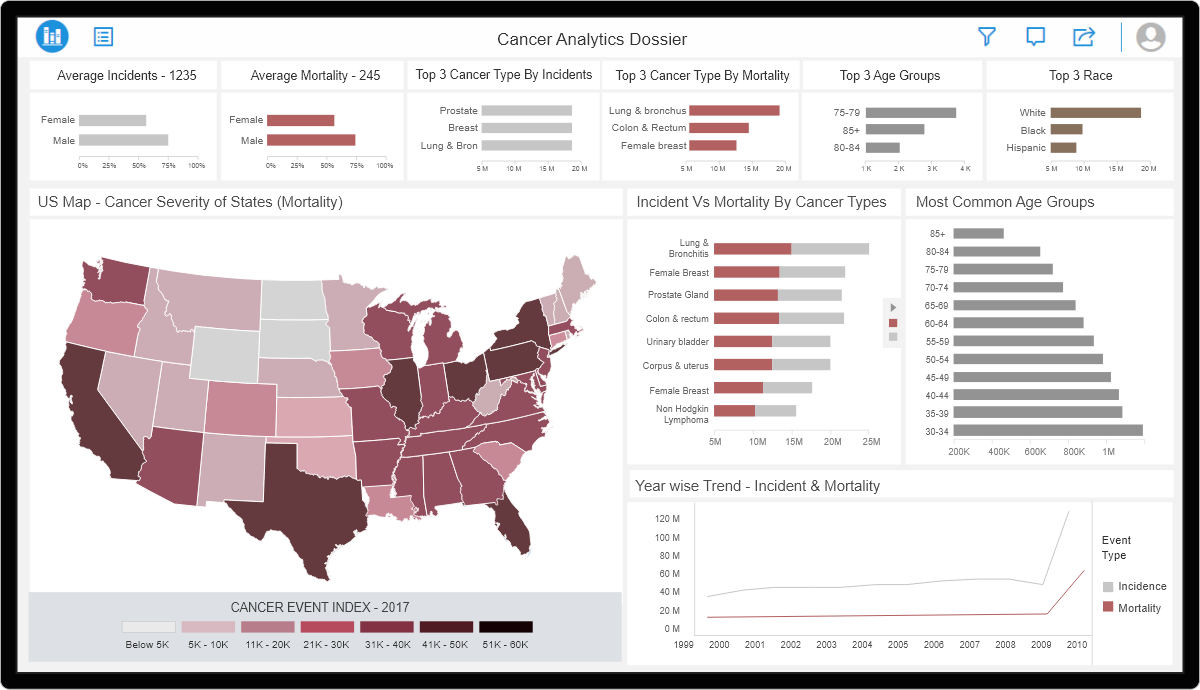
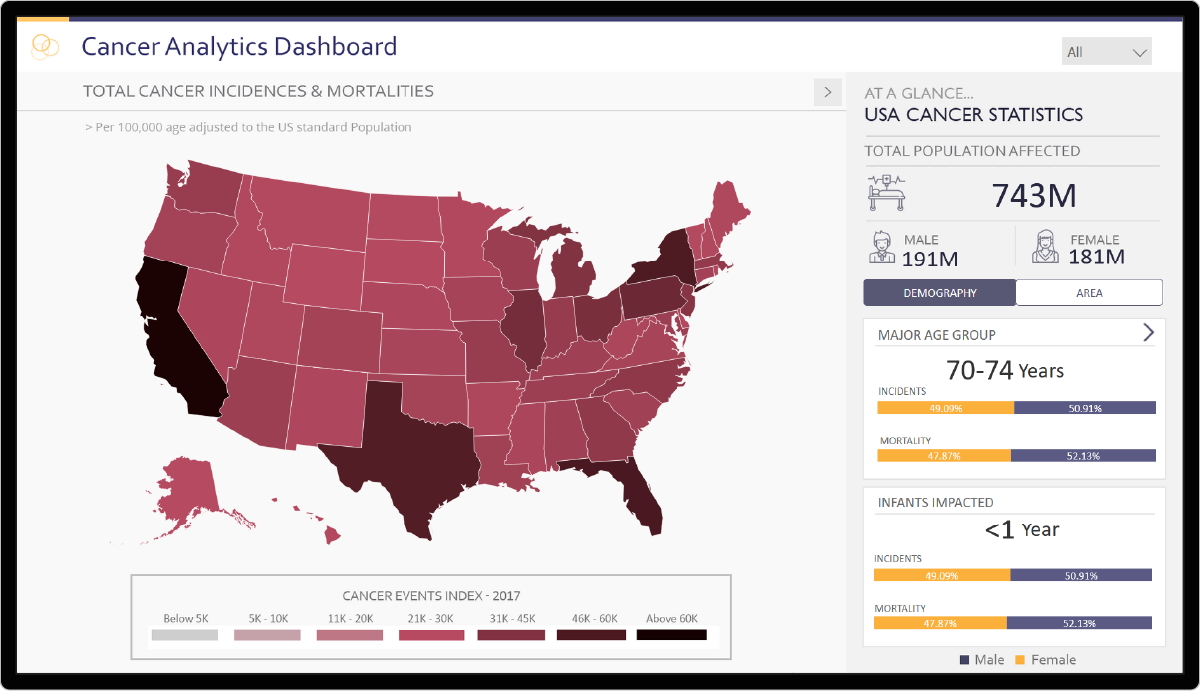
The Cancer Analytics dashboard provides insights into the incidence and prevalence of cancer and the distribution of people affected by cancer across the US. Caregivers, hospitals, pharma companies, and patients can gain actionable information on cancer types, geographies/regional distribution, and related data such as age, gender, and race through this dashboard. The dashboard is meant to enable users to make better informed decisions and improve health outcomes.
Challenges
Some of the major challenges faced by Health Care Customer for analysis of cancer were :
- It was tough to compile, analyze and slice and dice the cancer data as it was a bit too overwhelming
- There was no comprehensive solution where the ministry of health could know the impact analysis and drive further decision(s)
- Narrowing down to only the important KPIs took much time
- Calculation of Mortality Rate involves many factors, hence consumed time
Solution
We displayed an overall comprehensive solution on the Impact of cancer in the United States through an Interactive Dashboard which had the following features :
- Powerful Insights suggestive of most likely cancer occurrences based on a typical region, type, age and race leading to Increased Infrastructure and Cancer Treatment preparedness
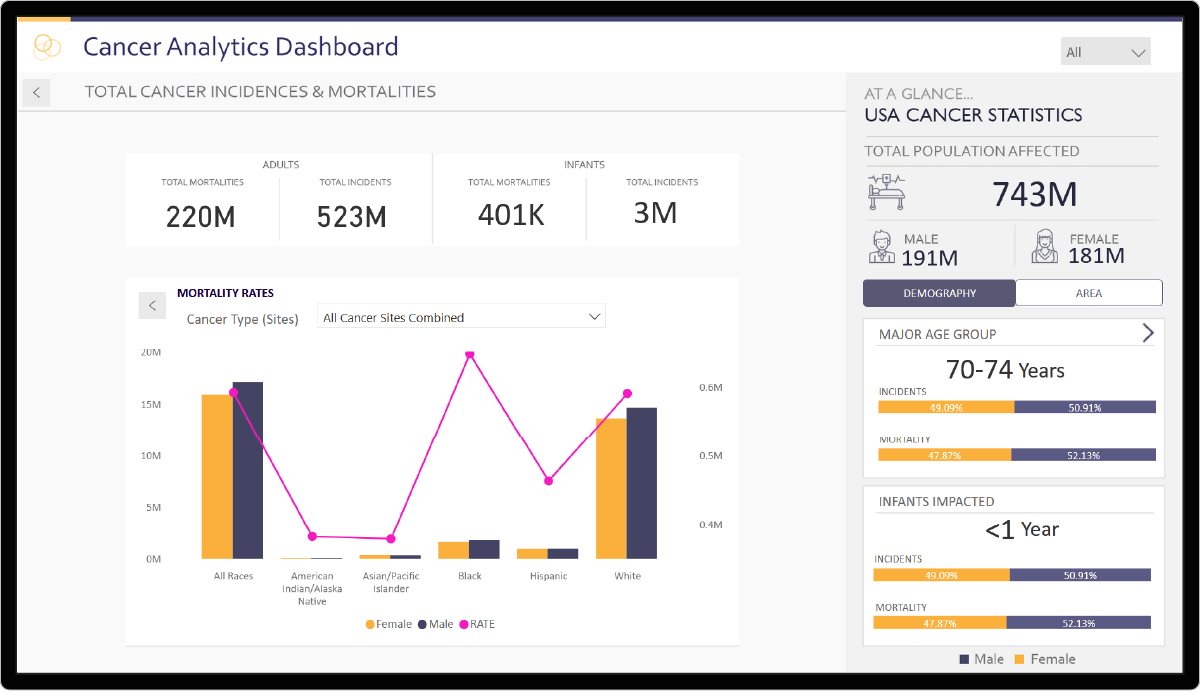
- Advanced Analytics comparing various regions helping to identify direct patterns among various Cancer types and area
- Health Status indicators such as Mortality and Incidence rates helping in analyzing population mortality data by cause of death in more detail and thus helping in future prevention of it
Reduced time to insight
Increased infrastructure preparedness for the most common cancer types
Reduced mortality rate
Increased treatment availability