


Organizations are becoming more data-driven to take business decisions faster than ever before. Business users expect quick interpretations of their data to act on insights in real-time. This is where data storytelling kicks in. Data alone, can’t tell you insights, but through data storytelling techniques you can better understand the data and get faster and easier access to key business insights. Data storytelling is about creating a compelling narrative anchored by three basic elements: Data, Visuals, and Narratives. Data-driven storytelling often involves the use of visualization techniques to support or complement a written or spoken narrative. In this blog, we will dig into why narratives in data storytelling are so important.
What are Narratives in Data Stories?
Effective storytelling with data moves the audience to understand the core of your insights, understand the key takeaways, and at the end act on your recommendation. Story narratives are nothing but written messages or annotation of the key data insights. Story narratives play an important role in convincing your audience to understand the insights and persuade them to act on them. Mostly narrative acts as a supporting element to visual stories, which goes well with other data visualization. Narratives can be static, dynamic, or automated depending on what type of data story you are telling your audience.
Static Narratives:
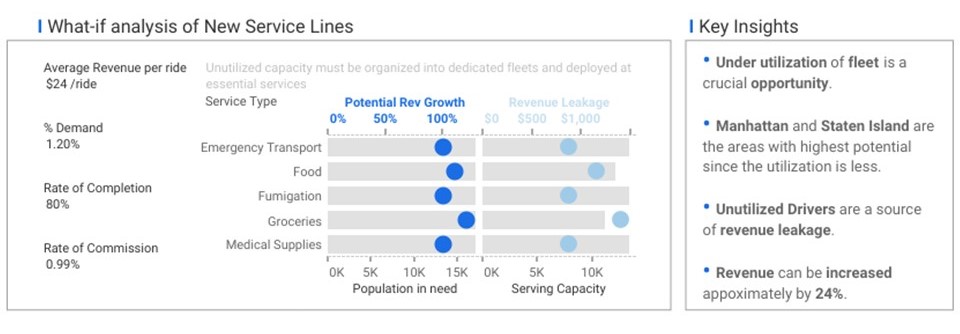
Static narratives are primarily used to convey key insights along with visualizations using simple, everyday human language. A static narrative approach is used to tell explanatory stories to your audience. You can get your point of view across clearly to your audience using simple narratives along with effective visualizations. The static narrative follows a linear approach in which data is presented in chronological order using a traditional story arc with beginning, middle, and end. It focuses on heavy messaging and clarity of thoughts and a specific call to action from the audience’s perspective. Typically, you will find such a narrative approach followed in author-driven data stories such as data journalism, PowerPoint decks, infographics, and static representations of data. Though this is the most common and standard approach of telling narrative stories at times it might give biased perspectives because of the inability to deep dive into data.
Let’s see a static narrative example:
Dynamic Narratives:
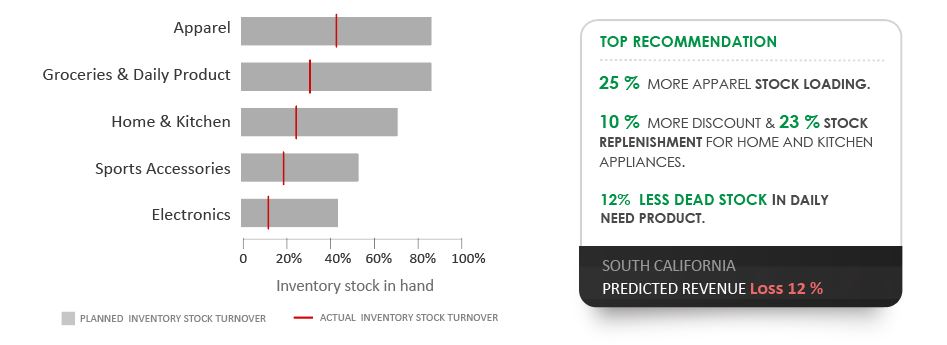
Dynamic narratives can be a good alternative option in absence of automated narratives to create basic narratives to support your visual story. These focus more on the explanatory analysis by highlighting key KPIs and other important data insights using pre-defined dimensions and measures. This works as an out-of-the-box feature of an analytical tool to summarizes visualizations or report narratives that are customizable. These narratives are not auto generated so they often require more manual effort to craft sentences using static and dynamic text fields. You can map the text to existing fields, dimensions, and measures and get the values driven through charts or filters. You also have all basic formatting options available to highlight the key insights which require more attention from the end-user perspective. This option is good for telling short dynamic narrative stories in absence of automated Natural Language Generation (NLG) driven narratives.
Here is a dynamic narratives example:
Automated Narratives:
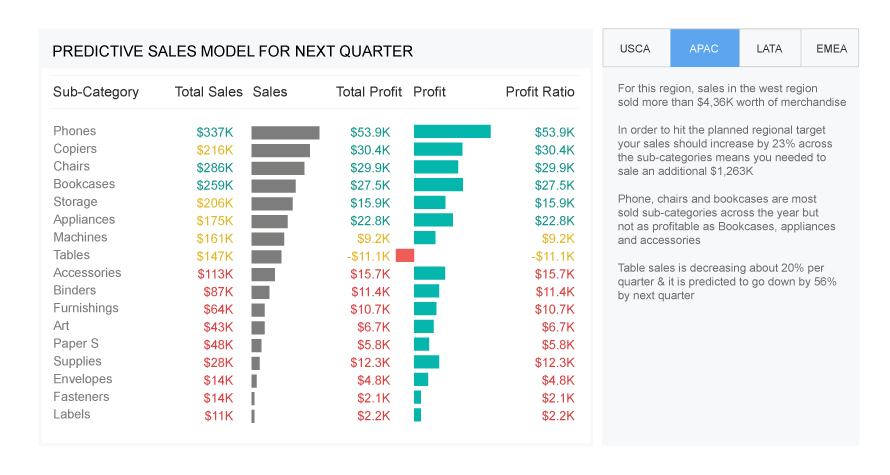
Next-gen analytical tools highlight automated narrative features in their analytical apps to quickly summarize visuals and reports by providing built-in customizable insights. These features are highly dynamic and with one click they automatically generate a summary of your key insights from your visualization. It combines the art of data storytelling with Natural Language Generation (NLG) capabilities. NLG capabilities interpret the data and generate English commentary (narrative) on the underlying data as a result, instead of trying to derive patterns or relationships from standalone visualizations, users can act on NLG-powered recommendations. Such a machine learning-powered narrative approach allows the end-user to interact with data, ask questions, explore, and tell their own data story. It is good for explanatory and exploratory data analysis.
Here is an example of automated narratives:
Overall narrative plays an important role in laying a solid foundation for making data-driven decisions by giving a glimpse of the data story in a more structured manner to display the hidden truth behind the data.
What to learn more? Get Started with our Data Storytelling solution to accelerate your data-driven decisions.
Recent Blogs

What Retail Media Can Learn from Instacart’s AI Strategy
June 24, 2025

Beyond Chatbots: How Agentic AI Is Automating High-Stakes Business Decisions
June 11, 2025

From Batch to Real-Time: The Future of Data Distribution Using Databricks Delta Sharing
June 4, 2025

Accelerating Databricks Serverless Adoption with Agentic AI & Proven Practices
May 29, 2025