

Modern analytical applications face an increasing number of challenges. A key challenge is enabling end users to make sense of a world flooded in data. Introduction of new information, analyses, and data & analytics streams into the business decision-making requires developers of analyses to expand their roles – they serve as critical intermediaries between decision-makers and the flood of new incoming information.
If done incorrectly, an analytical application can create challenges for business decision-makers and introduce uncertainty. A poorly constructed analytical application can have serious repercussions, unnecessarily extending timelines as decision-makers grapple to make sense of the very information flows that were originally supposed to help them.
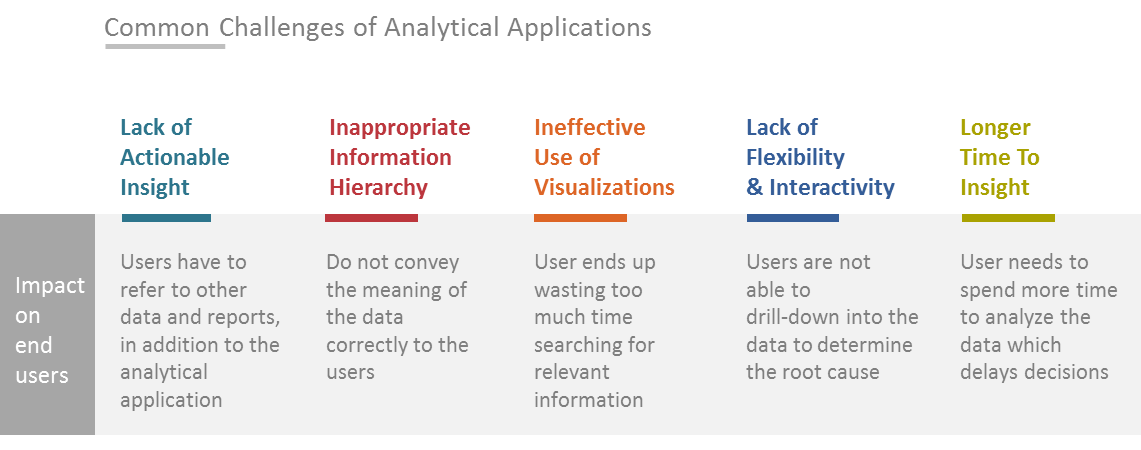
Intended end users don’t use nearly 55% of Analytical application due to lack of actionable insights. In most organizations, BI developers or business analysts choose the visualizations in dashboards/reports. Although they understand the data, occasionally they lack the skills to represent it visually.
Following are the common challenges observed in analytical applications:
To overcome these challenges BI developers need to adopt additional skills. The skill to understand the business use of data, an ability to tell insightful stories visually in a manner so that users can absorb data easily and quickly, and understand the capabilities and constraints of the BI tools used for creating the analytical application – The art of Data Storytelling.
What is Data Storytelling?
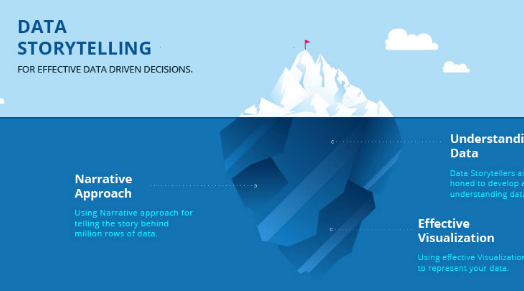
Data Storytelling skills are becoming an essential aspect of gaining and communicating quick insights from the data. It encompasses the entirety of the art and science of turning data and information into knowledge. Data storytellers are trained to develop a deep understanding of how to communicate stories using both visual and narrative aspects. Their skills are an essential part of modern-day business communication.
Storytelling consists of 3 key components – Data, Narrative, and Visualization. Data is the foundation of your story; narrative connects insights and adds emotion (which in turn helps humanize your insights); effective visuals simplify and explain any situation, regardless of complexity. Together these 3 components, make information easy-to-consume, memorable, and actionable.
A compelling visual story enables decision-makers to analyze complex data sets faster, allowing them to see patterns that are otherwise hidden behind a wall of numbers, grid lines, and boxes. It gives them the ability to see relationships among events that, on the surface, may appear completely disconnected.
Data Storytelling is More than UI/UX
To get effective data storytelling results, you need to use a wide array of tactics and methods across the three components mentioned above. One of the more obvious methods is the use of charts and graphs, colors, and layout choices required for presenting data visually. On the surface, this may seem like a straightforward process, but a lot of intelligence gathering and best practices go into these decisions such as understanding the needs of every decision maker and forecasting the desired outcome of the project. This requires people with a specialized skillset – those who not only understand the User Interface and User Experience design (UI/UX) aspects of the project, but also the science of visually representing stories from data.
There are four types of stories for derivation from data namely Descriptive, Diagnostic, Predictive and Prescriptive. We know these four types together answer everything a business needs to know – from what is going on in the business to what solutions to adopt. With the right choice of analytical techniques data experts can exact these insights from the data but may often struggle in representing these stories visually to influence the decision makers.
Storytelling ≠ Story writing
The below example depicts how the same data is represented as a “visual” to aid in discovery of insights and then to narrate a story for comprehension with the help of right visuals, narratives, and highlights.
Businesses are concerned about the value they extract from the data they collect. In order to do that data experts need to use the art of Data Storytelling to communicate the findings meaningfully with decision makers.
Know Your Audience
To be effective, data storyteller need to understand the business context of the analytical application. This allows them to combine the right elements in the right order for the right audience. For example, data storyteller should understand the context of the analysis (strategic, tactical, operational), the intended audience, the insights sought by the user, and more. A 360-degree view of the business dashboard for a CEO will be fundamentally different from an operational KPI-based dashboard for a sales manager and the data storyteller is expected to understand this thoroughly.
Combine Soft and Hard Skills
Data storytellers also apply their understanding of how people absorb information to the design process. The goal is to avoid information overload by presenting the right data elements using the most appropriate visuals. The goal of is to enlighten users, not to leave them in a state of confusion.
More specifically, data storyteller is a design professional with a combination of creative talents and analytics skills. They have an eye for detail. They possess extensive hands-on experience in user interface (UI) design tools like Adobe Illustrator and Adobe Photoshop—skills necessary for designing analytical application mockups. Data storytellers know how Business Intelligence tools work, and how they can complement visualization capabilities with the tools so that they can work with end-users and data & analytics developers alike and deliver visualizations through a collaborative, iterative process.
Data Storytelling is Here to Stay
Data storytelling expertise is an increasingly important skill to master in a world bursting to the seams with data, facts, and statistics. Without it, the ability to construct visual narratives and deliver crucial insights stands at risk of being diminished or even missed entirely.
Watch out this space for more on Data Storytelling!
Recent Blogs

The $1.7 Trillion Shelf Crisis: How AI-Powered On-Shelf Availability Is Rewriting Retail’s Biggest Loss Story
April 16, 2026

From Manual Audits to Machine Vision: How AI Store Operations Are Eliminating Retail’s Execution Gap
April 15, 2026

Why Your BI Migration Is Failing – and How to Fix It With Automation
April 10, 2026

Your Audience Feels Something When They Watch Your Content. Are You Monetizing That Signal?
April 9, 2026