


There is a general belief that narrating stories or data storytelling is a specialized skilled job that must be done by data visualizers or data storytellers using sophisticated design and BI tools. However, it is imperative these days that everyone becomes a data storyteller in some capacity. With increasing data volumes and heightened interactions with data daily, having visual communication skills, is a powerful skill to have.
So, how do you do this? Whether it is a client presentation, pitching clients, quarterly business reviews, or internal team discussions, opportunities are endless to become a Data Storyteller. You might even be doing it already and not even know it!
There are five key focus areas to master becoming an effective Data Storyteller.
1. Visual thinking
Usually people often tend to present facts and figures in their absolute form such as charts and tables, without any storyline or narration around it. For the audience, it is difficult to consume or remember trends and patterns in the charts. Here is where Data Storytelling comes into play.
Take your common spreadsheet full of data highlighting your company’s quarterly results. This might be presented to the audience in a formal setting and the purpose is declarative. Instead, if you were to utilize the art of Data Storytelling, you start to think visually, considering the nature and purpose of the visualizations. Before presenting, ask yourself these two questions:
Is the information conceptual or data-driven? Here the goal is to present the idea.
Am I declaring something or exploring something? Here the goal is to inform and enlighten.
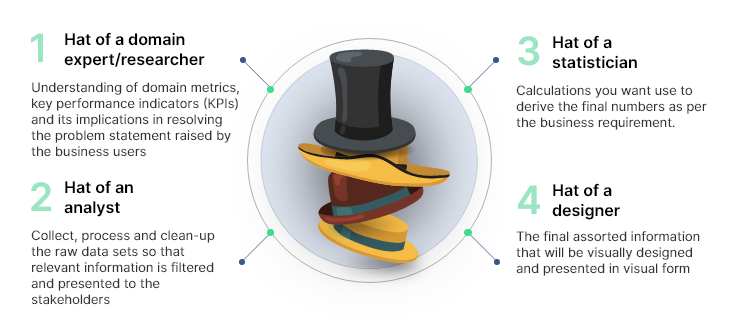
2. Which hat do you wear when you see the data?
Narrating a story from the data can often be complex and time consuming if not done right. Beginning with data in its raw stage to the final output of presentation; a data set gets processed and passed upon through multiple profiles. When working with data sets there are four hats from a domain expert to an analyst, to a statistician, and finally a designer that you should wear.
3. Sketch an idea from the data
You don’t need to be a graphic design expert, using something as basic as pen and paper you can easily sketch out what you want to get across as a first step. Sketching out the data can help integrate various kinds of knowledge at the ideation stage. De-cluttering a heavy data set by sketching helps to identify relevant information, its hierarchy, and flow.
Sketching relies on conceptual metaphors, taking place in more-informal settings, such as off-sites, strategy sessions, or early-phase innovation projects. It can be used to find new ways of seeing how the business works or to answer complex managerial challenge such as restructuring an organization, producing a new business process, or codifying a system for decision making.
4. Power of metaphors in data storytelling
Have you ever visualized an area chart that resembles a mountain? As a metaphor, mountain can be used as an element of expression on how the company sales performance grew over the years touching its peak.
Numerous metaphors are woven into the fabric of data science itself, such as data warehouses, data lakes, and data mining. When narrating stories, metaphors are essential for breaking down language barriers that stand between you and your audience. They work best when you have complex concepts or ideas to convey. Advantages of using metaphors are they:
- Make the story more interesting and fun
- Keep the audience engaged
- Help bring the meaning and significance of the data to the forefront
- Assimilate the unfamiliar by comparing it to what is familiar
5. Getting personal with data story telling
More often than not, more time is spent gathering the data than actually composing the story around it. Without a good data story, visualizations are relatively ineffective. The story connects the dots between the data and the audience. It reveals the data’s meaning and significance, educates, and transforms the audience.
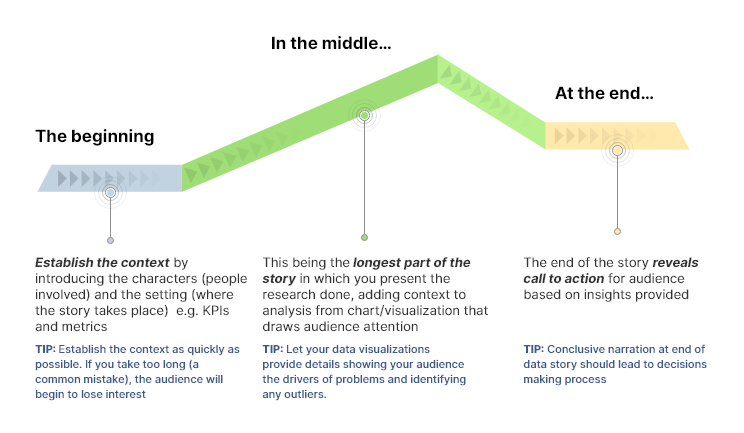
Based on Freytag’s pyramid theory, every story has a beginning, a middle, and an end. Each of them has a different purpose. When structuring your story, be sure that each part achieves its purpose.
Moral of the data story
The data story you tell an audience requires more than just data and visualizations. Good data is only one essential element. A good data story is one that engages, entertains, educates, and transforms the audience to act upon it.
Ready to get started? No matter where you are in your data storytelling journey, we are here to help. Get started now!
Hemal Sheth is an AI and Data Product Design expert with two decades of experience turning complex data into intuitive, business-ready solutions. Specializing in human-centered design, he creates impactful dashboards and data products...
Read Full BioRecent Blogs

The $1.7 Trillion Shelf Crisis: How AI-Powered On-Shelf Availability Is Rewriting Retail’s Biggest Loss Story
April 16, 2026

From Manual Audits to Machine Vision: How AI Store Operations Are Eliminating Retail’s Execution Gap
April 15, 2026

Why Your BI Migration Is Failing – and How to Fix It With Automation
April 10, 2026

Your Audience Feels Something When They Watch Your Content. Are You Monetizing That Signal?
April 9, 2026